Fig. 1.

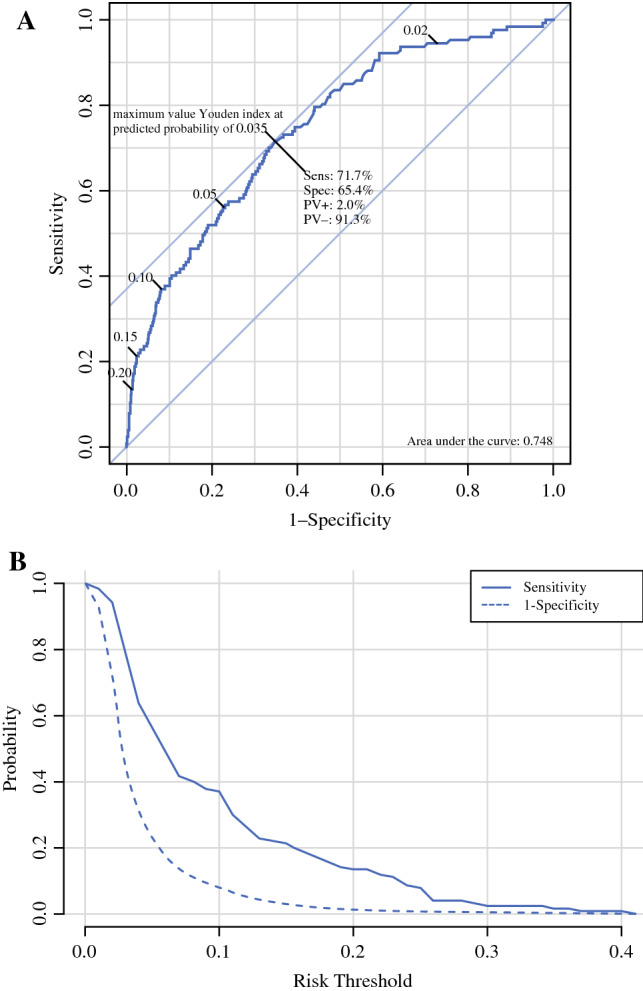
A Receiver operating characteristic (ROC) curve for discrimination of the prediction model. B The sensitivity and 1-specificity for probability thresholds. The graphs shows the sensitivity and specificity for probability thresholds of the prediction model; for instance at a predicted risk for LN metastases of 3%, the sensitivity was 0.80 and the specificity was 0.56. For a predicted risk of 5%, these were 0.56 and 0.77, and for a predicted risk of 10%, these were 0.37 and 0.92
