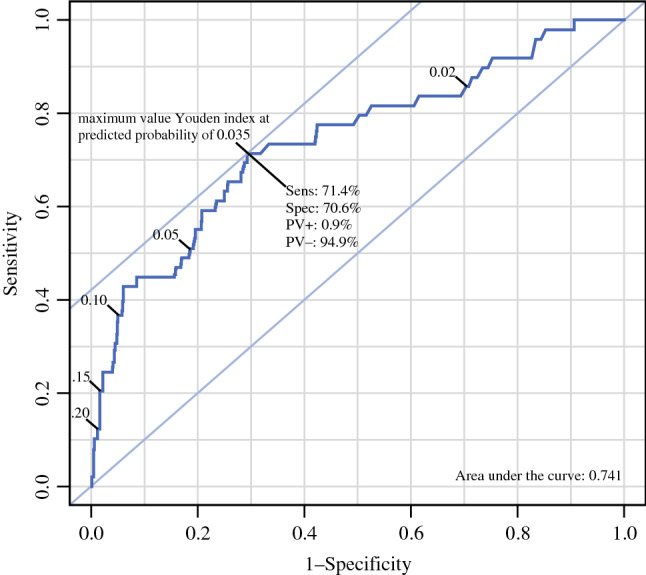
Fig. 5.

Receiver operating characteristic (ROC) curve of the model validation cohort. At each probability threshold of the model, the sensitivity and specificity are given. Some thresholds are given in the graph. The Youden’s index is calculated as follows: sensitivity + specificity − 1, for each threshold probability. At the maximum, the combination of sensitivity and specificity is optimal. At the maximum value of the Youden’s index, the sensitivity, the specificity, the positive predictive value and the negative predictive value are calculated
