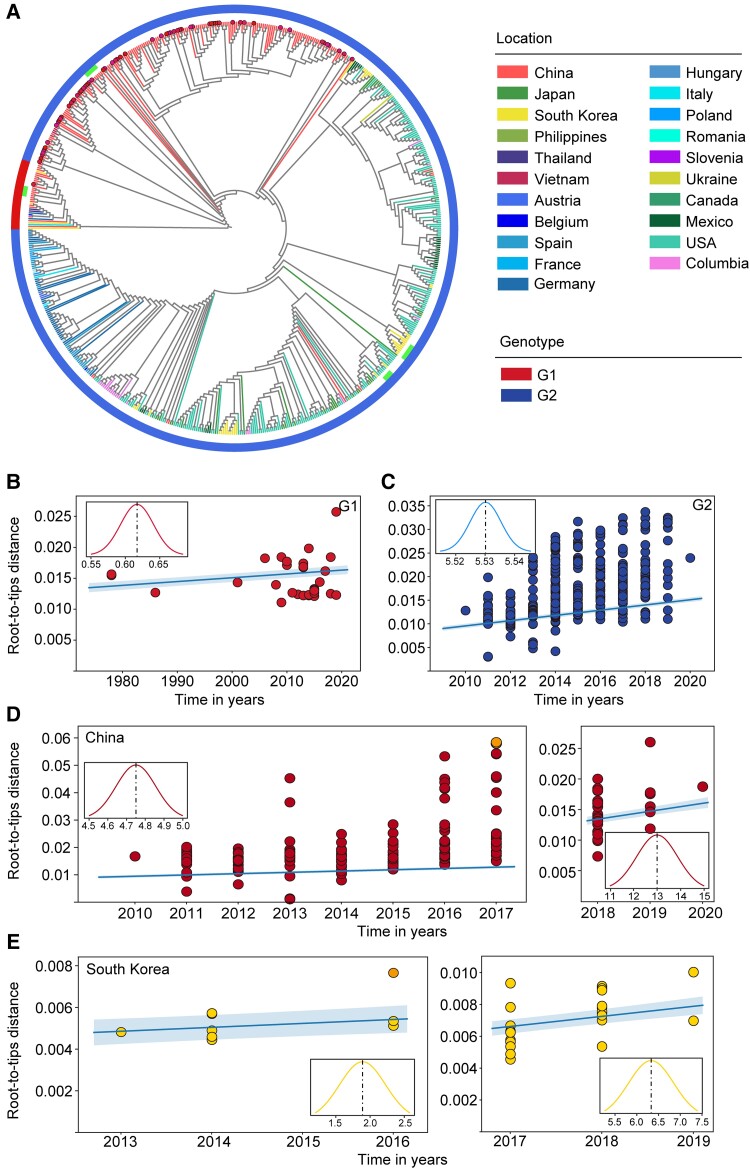
Fig. 5.
Phylogenetic analysis of complete PEDV genomes (n = 672) and estimated evolutionary rate of PEDV strains. (A) Phylogenetic tree constructed from 672 complete PEDV genomes using ML method. The outside layer denotes the genotypes. The highlighted dots indicate 65 PEDV strains sequenced in this study. The extra bars indicate the clusters of wild vaccine strains and vaccine-like strains. (B–E) Root-to-tip distance plots on sampling date and the estimated evolutionary rates of PEDV strains. (B) Strains (n = 33) of G1 genotype around the world, (C) strains (n = 639) of G2 genotype around the world, (D) Chinese strains of G2 genotype collected before the year 2018 (n = 173) and after the year 2018 (n = 34), and (E) Korean strains of G2 genotype collected before the year 2017 (n = 13) and after the year 2017 (n = 24). The highlighted strains in the outer plots were excluded in the linear fitting and evolutionary rate estimation according to TreeTime (Sagulenko et al. 2018). The inner plots show the posterior probability densities of the mean estimated evolutionary rate and the x-axis represents the evoltionary rate (×10−4 substitutions per site per year).

