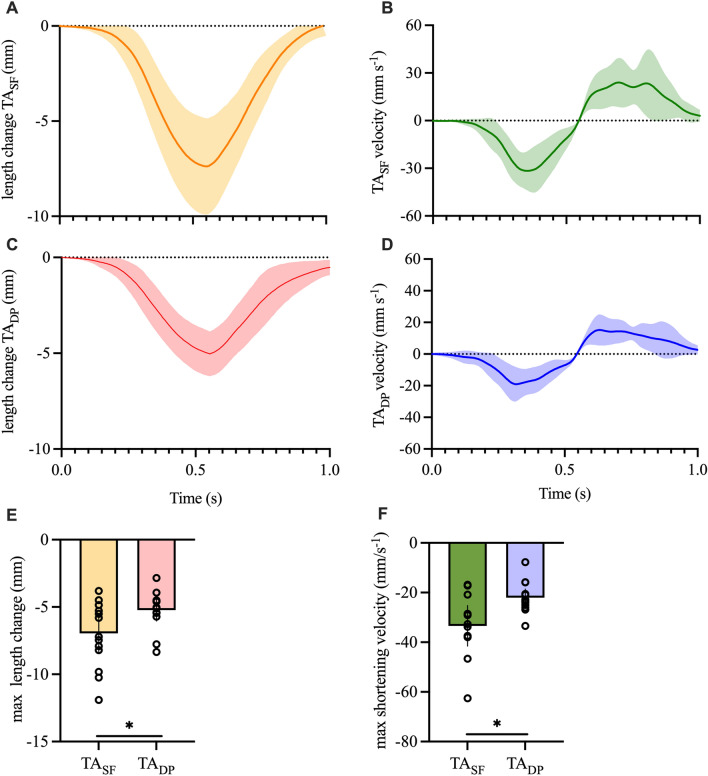
Figure 4.
Overview about the measurements obtained with ultrasound for the TASF and TADP while measured during submaximal trials. (A) + (C) show fascicle length changes of the TASF (A) and TADP (B) while (B) + (D) show the respective shortening velocities. Figure (E) shows the average maximal length changes being significantly greater for TASF. (F) Average maximal shortening velocities being significantly greater in the TASF compared to the TADP (*p ≤ 0.05).

