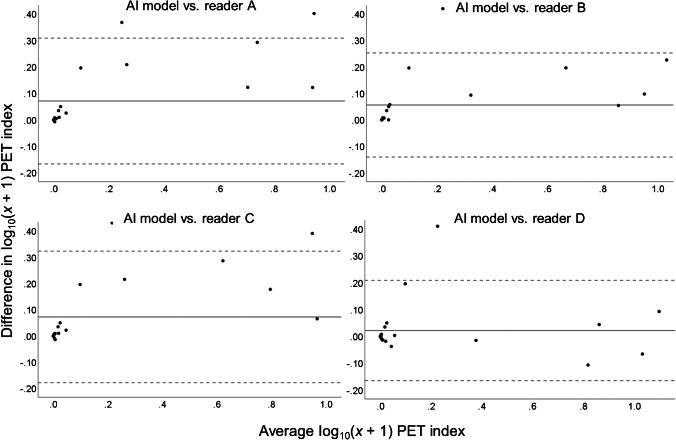
Fig. 4.
Bland–Altman plots illustrating the interreader reliability between the AI model and each physician regarding PET index estimation after log10(x + 1) transformation (n = 26). The solid line represents mean differences between the two log10(x + 1)-transformed PET indices. The dotted lines indicate the upper and lower 95% limits of agreement (mean difference ± 1.96 multiplied by the standard deviation of the mean difference). The same plots with subject labeling are provided in Supplementary material 2. The seven data points outside the most-leftward main cluster in all four plots correspond to the same subjects

