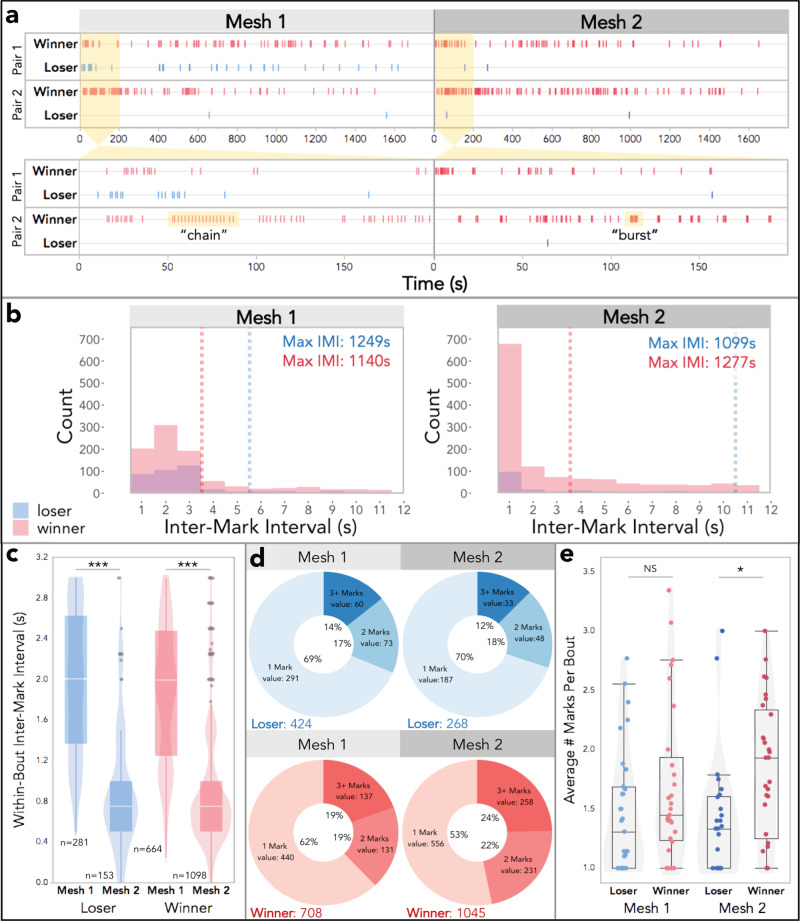
Fig. 3. Temporal dynamics of urine mark allocation across mesh trials.
a Example event plots depicting urine marking of two pairs of male competitors over the course of both mesh trials for the trial duration (top) and a zoomed-in view of the first 200 s (bottom). “Chain”-like and “burst”-like marking bout examples are highlighted in yellow. b Histograms of the inter-mark intervals (IMIs) for winners and losers in both mesh trials. Median values are indicated with dashed lines. The range of IMIs extends to nearly the full trial length (only the first 12 s is shown). The maximum values are reported in the top right corner. Mesh 1: 65% of all IMIs are shown (<12 s), 57% of loser IMIs and 69% of winner IMIs. Mesh 2: 68% of all IMIs are shown (<12 s), 51% of loser IMIs and 72% of winner IMIs. c Box and violin plots of within-bout IMIs by fight outcome and mesh trial. d Donut plots by fight outcome and mesh trial depicting the proportions of bouts composed of: 1 mark, 2 marks, or 3+ marks. Mark totals are indicated (bottom left). e Boxplot of the average number of marks per bout by fight outcome and mesh trial. c, e Boxplot midline: median, box limits: upper and lower quartiles, whiskers: 1.5× interquartile range, points: outliers. d, e Linear mixed models were used to model relationships (M5-M6: Table S3), analyses of variance were used to test for overall effects, and post hoc pairwise comparisons were performed using the emmeans package (significance codes: NS p > 0.05; *p < 0.05; **p < 0.01; ***p < 0.001). Dependent variables were logarithmically transformed to meet assumptions for model residuals.

