Figure 5.
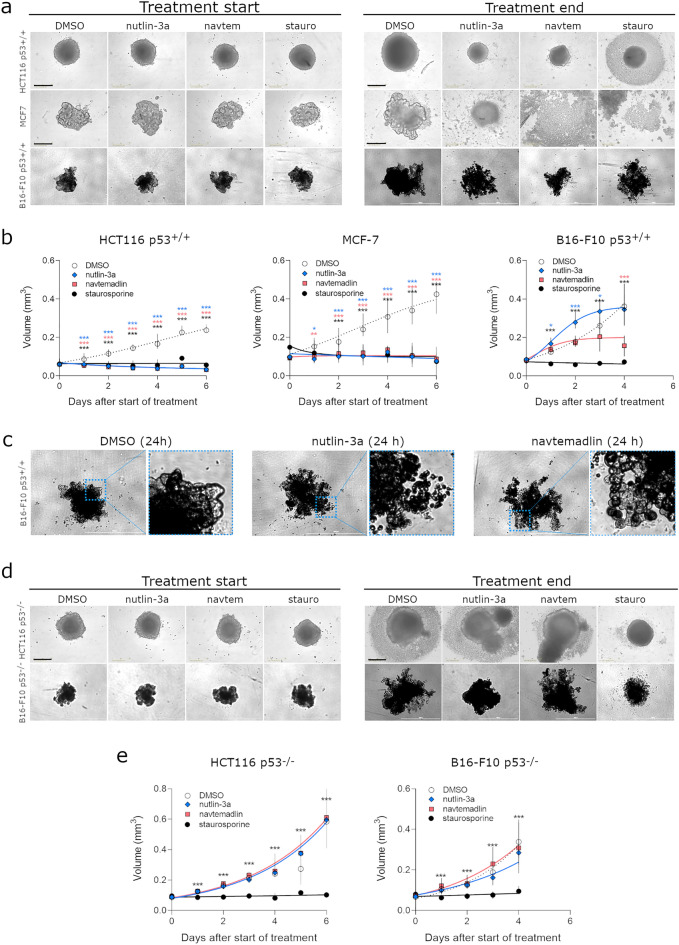
MDM2 inhibitors reduce growth of human and mouse p53WT cells cultured as spheroids. (a) Brightfield images of HCT116 p53+/+, MCF7 and B16-F10 p53+/+ spheroids at start and end of treatment. (b) Growth curves of p53WT spheroids treated with DMSO, nutlin-3a (human cells: 5 μM; mouse cells: 10 μM), navtemadlin (human cells: 1 μM; mouse cells: 2 μM), and staurosporine (human cells: 2 μM; mouse cells: 5 μM). Black scale bars = 400 µm; white scale bars = 1000 µm. (c) Brightfield images of B16-F10 p53+/+ spheroids after 24 h treatment with DMSO, nutlin-3a and navtemadlin. (d) Brightfield images of treated HCT116 p53−/− and B16F10 p53−/− spheroids at start and end of treatment. (e) Growth curves of HCT116 p53−/− and B16F10 p53−/− spheroids treated with DMSO, nutlin-3a, navtemadlin and staurosporine. Data points represent the median value ± 95% CI (n = 6–18 spheroids/treatment) from 2 to 3 independent experiments. Statistical significance was assessed by mixed-effects ANOVA with matching followed by post-hoc Dunnett’s correction for multiple testing (unpaired, two-tailed, α = 0.05). Adjusted P values from the Dunnett’s test are indicated (*P < 0.05; **P < 0.01; ***P < 0.001).

