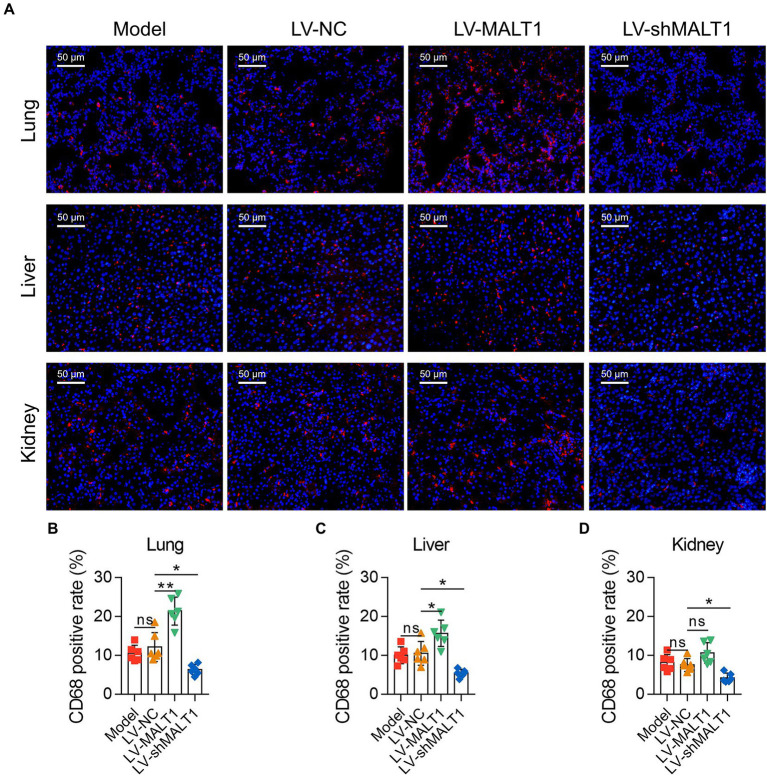
Figure 4.
Effect of MALT1 on macrophage infiltration in LPS-induced septic mouse model. IF staining of macrophages in lung, liver, and kidney tissues among the Model, LV-NC, LV-MALT1, and LV-shMALT1 groups (A). Comparison of the CD68-positive rate in the lung (B), liver (C), and kidney (D) among the Model, LV-NC, LV-MALT1, and LV-shMALT1 groups. n = 6 in each group. One-way ANOVA plus Tukey’s post hoc test was applied. Ns, not significant; *p < 0.05; **p < 0.01.

