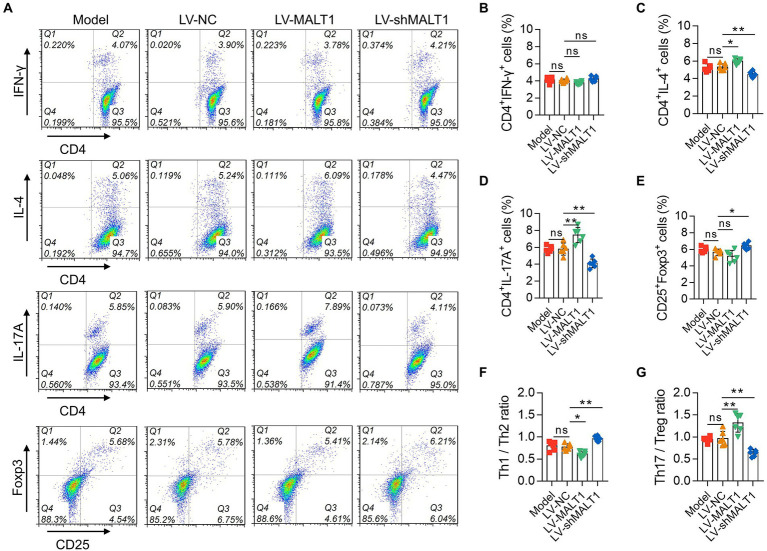
Figure 6.
Effect of MALT1 on CD4+ T-cell polarization in LPS-induced septic mouse model. Detection of CD4+ T cells by flow cytometry (A). Comparison of Th1 (B), Th2 (C), Th17 (D), and Treg (E) cells, Th1/Th2 ratio (F), and Th17/Treg ratio (G) among the Model, LV-NC, LV-MALT1, and LV-shMALT1 groups. n = 6 in each group. One-way ANOVA plus Tukey’s post hoc test was applied. Ns, not significant; *p < 0.05; **p < 0.01.

