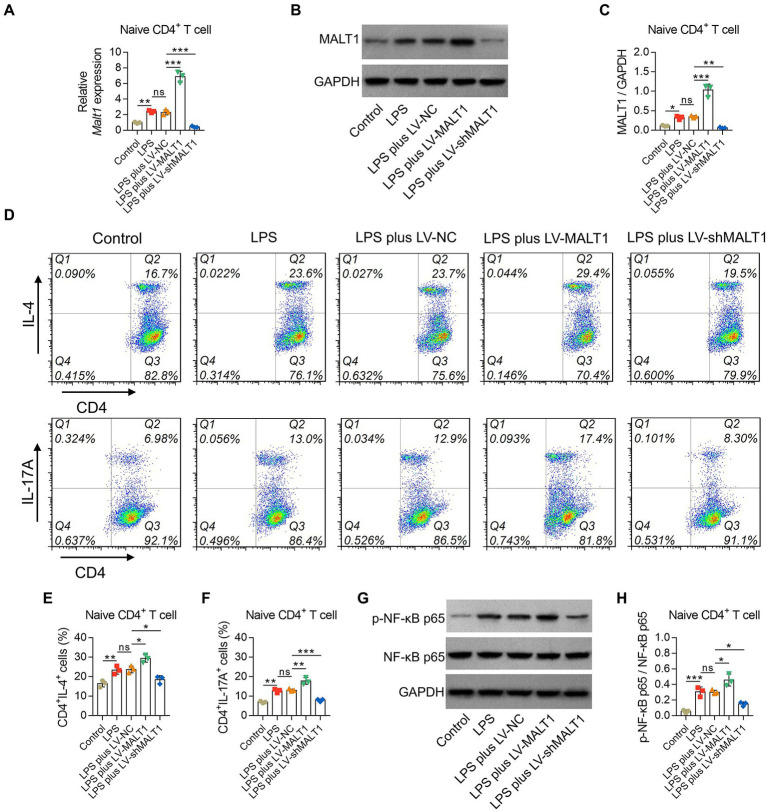
Figure 9.
Effect of MALT1 on the polarization of LPS-treated naïve CD4+ T cells. Comparison of MALT1 mRNA levels (A) and protein levels (B,C) among Control, LPS, LPS plus LV-NC, LPS plus LV-MALT1, and LPS plus LV-shMALT1 groups. Flow cytometry analysis of Th2 and Th17 cells among Control, LPS, LPS plus LV-NC, LPS plus LV-MALT1, and LPS plus LV-shMALT1 groups (D). Comparison of Th2 (E) and Th17 (F) cell proportions among Control, LPS, LPS plus LV-NC, LPS plus LV-MALT1, and LPS plus LV-shMALT1 groups. Western blot detection of p-NF-κB p65 (G) and comparison of the relative protein level of p-NF-κB p65 (H) among Control, LPS, LPS plus LV-NC, LPS plus LV-MALT1, and LPS plus LV-shMALT1 groups. n = 3 in each group. One-way ANOVA plus Tukey’s post hoc test was applied. Ns, not significant; *p < 0.05; **p < 0.01; ***p < 0.001.

