
FIGURE 1.
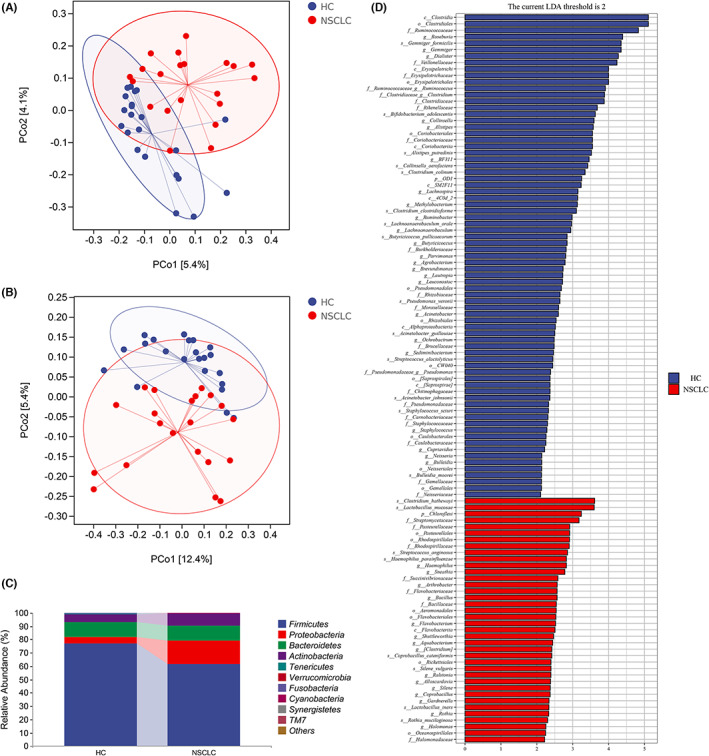
Analysis of intestinal flora characteristics of NSCLC patients and healthy people. (A) PCoA analysis of inter‐group Beta diversity based on Jaccard distance algorithm (PERMANOVA, p = 0.001) Blue represents HC group sample; Red represents the NSCLC group samples; (B) PCoA analysis of inter‐group Beta diversity based on unweighted UniFrac distance algorithm (PERMANOVA, p = 0.002); (C) Species composition analysis was performed at phylum level, and the relative abundance of the top 10 species was displayed by means of the samples within the group. (D) Histogram of LDA value distribution of species with significant differences, showing robust differential species between HC group and NSCLC group analyzed by LEfSe, by Wilcoxon test, p < 0.05. HC, healthy control group; NSCLC, non‐small cell lung cancer group.