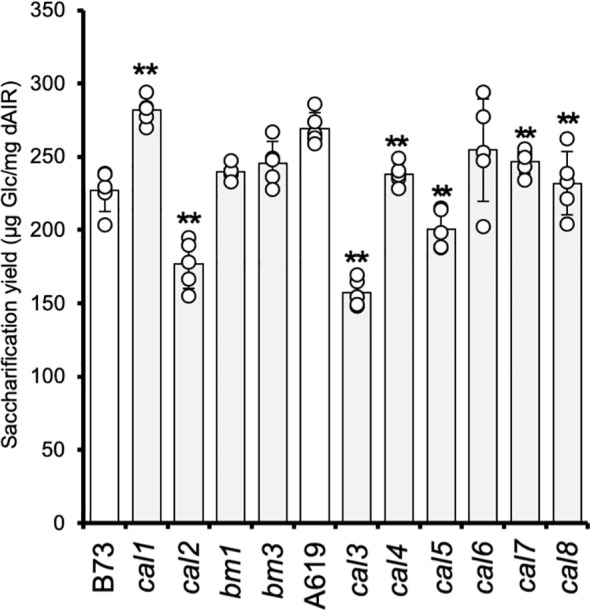
Figure 1.

Saccharification of cal mutant seedlings. The values correspond to the mean ± SD (n = 5). cal1, cal2, bm1, and bm3 are in the B73 genetic background. cal3, cal4, cal5, cal6, cal7, and cal8 are in the A619 genetic background. dAIR destarched alcohol insoluble residue. Asterisks indicate levels of statistical significance between each mutant and corresponding wild-type plant determined by two-tailed unpaired Student t- test at p-value < 0.01 (**).
