FIGURE 3.
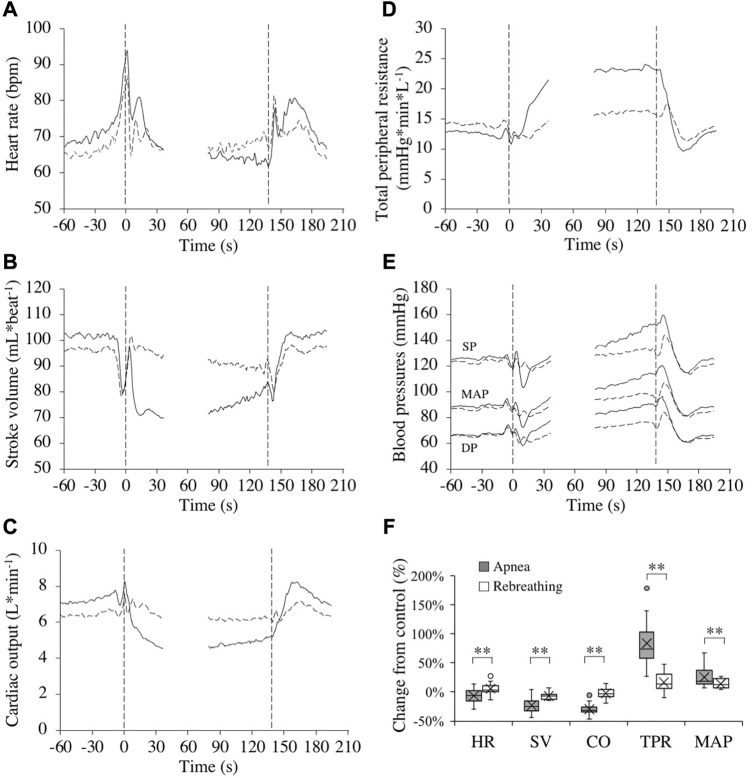
Cardiovascular responses (n = 17 or 18, see text) in association with apneas (solid lines) and rebreathing periods (dashed lines). Panel 3 (A–E) show the means of each variable from before tests (–60–0 s), during the first 35 s of tests (0–35 s), during the last 60 s of tests (78–137 s), and the first 60 s after tests (138–198 s). Vertical dashed lines indicate the start and end of apneas and rebreathing periods. Breaks in the lines reflect the fact that test durations varied among the subjects, and the position of the end of tests in the graphs has been adjusted for each subject to match the average duration of the tests (137 s). Error bars have been omitted for clarity. Panel 3 (F) shows boxplots for the relative changes in each variable (HR, heart rate; SV, stroke volume; CO, cardiac output; TPR, total peripheral resistance; MAP, mean arterial pressure) during 20–10 s before the end of apneas and rebreathing periods compared to their respective control value (see figure legend 2 for details). **p < 0.01 between apnea and rebreathing.

