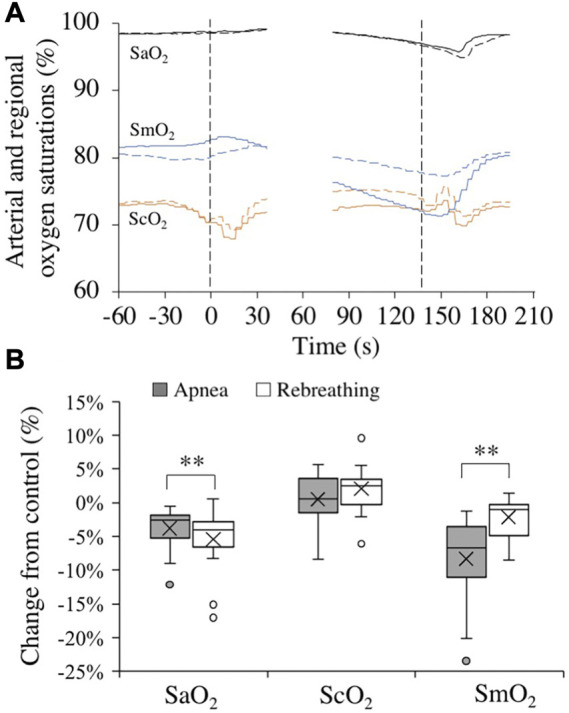
FIGURE 4.

Changes in arterial (black, SaO2, n = 18), cerebral (orange, ScO2, n = 18), and deltoid muscle (blue, SmO2, n = 17) oxygen saturations in association with apneas (solid lines) and rebreathing periods (dashed lines). Panel 4 (A) shows the means of each variable from before, during, and after tests (see figure legend 3 for details). Panel 4 (B) shows boxplots for the relative changes in each variable at nadir (SaO2) or during 20–10 s before the end of apneas and rebreathing periods (ScO2 and SmO2) compared to their respective control value (see figure legend 2 for details). **p < 0.01 between apnea and rebreathing.
