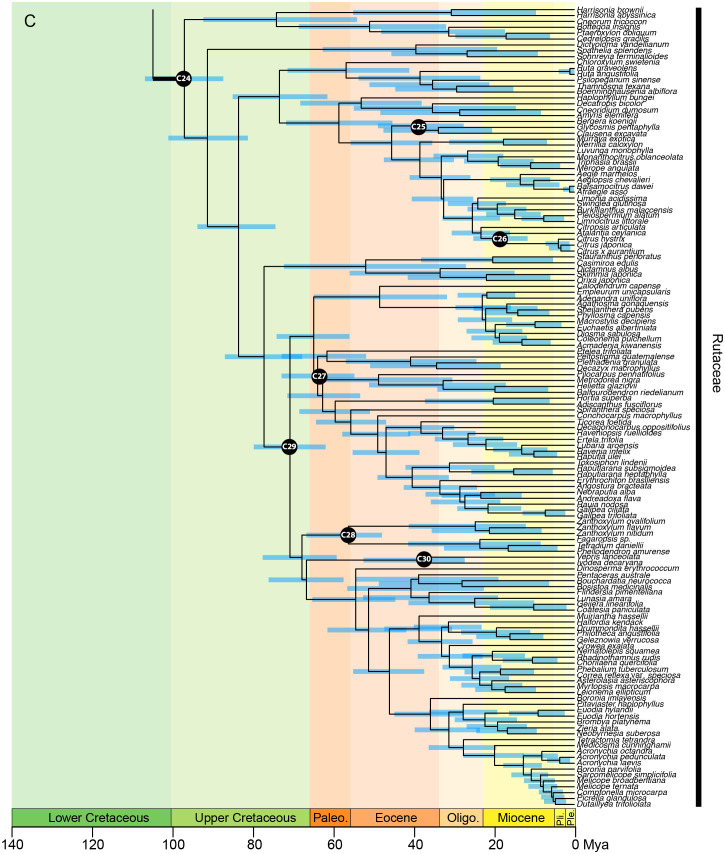
Figure 4C.
Chronogram of Sapindales as estimated under a relaxed-clock model with a normal secondary root prior distribution (node C01) and uniform primary calibrations. Tree topology was fixed to the concatenated tree (see Figure 2 ). (A) shows Nitrariaceae, Biebersteiniaceae, Sapindaceae; (B) shows Kirkiaceae, Burseraceae, Anacardiaceae, Simaroubaceae, Meliaceae, and (C) shows Rutaceae. Black circles with C01-C30 signify calibrated nodes (see Table 1 for fossil information); blue bars represent 95% highest posterior densities (HPDs); thickened branches indicate stem branches of families.

