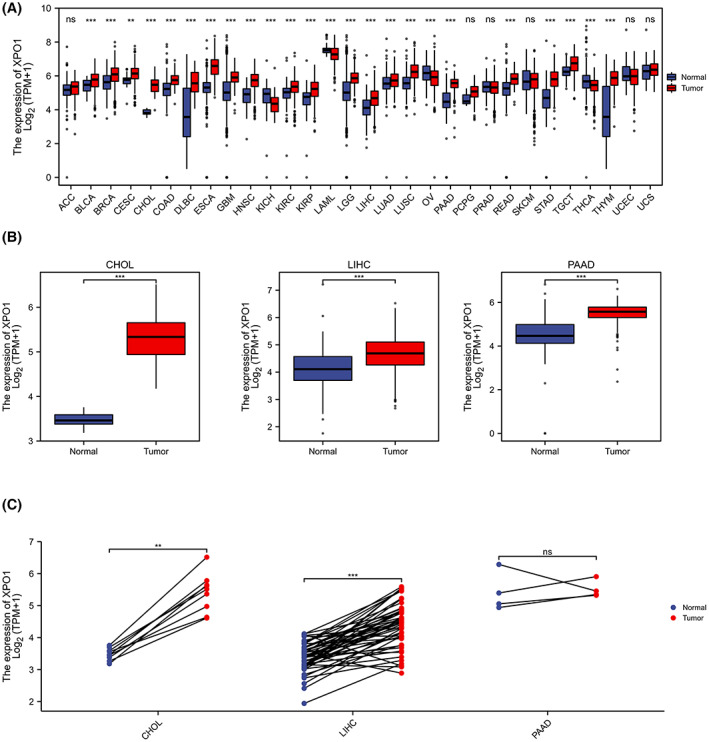
FIGURE 1.

Pan‐cancer expression of XPO1. (A) XPO1 expression in tumor and normal tissues in pan‐cancer data of the Cancer Genome Atlas (TCGA) and GTEx. (B) XPO1 expression in tumor and normal tissues in CHOL, LIHC, and PAAD from TCGA. (C) XPO1 expression in paired tumor and normal tissues in CHOL, LIHC, and PAAD from TCGA. Data were shown as mean ± SD. *p < 0.05, **p < 0.01, ***p < 0.001, and ****p < 0.0001. CHOL, cholangiocarcinoma; GTEx, genotype‐tissue expression; LIHC, liver hepatocellular carcinoma; PAAD, pancreatic adenocarcinoma; TCGA, the cancer genome atlas; XPO1, exportin‐1.
