FIGURE 4.

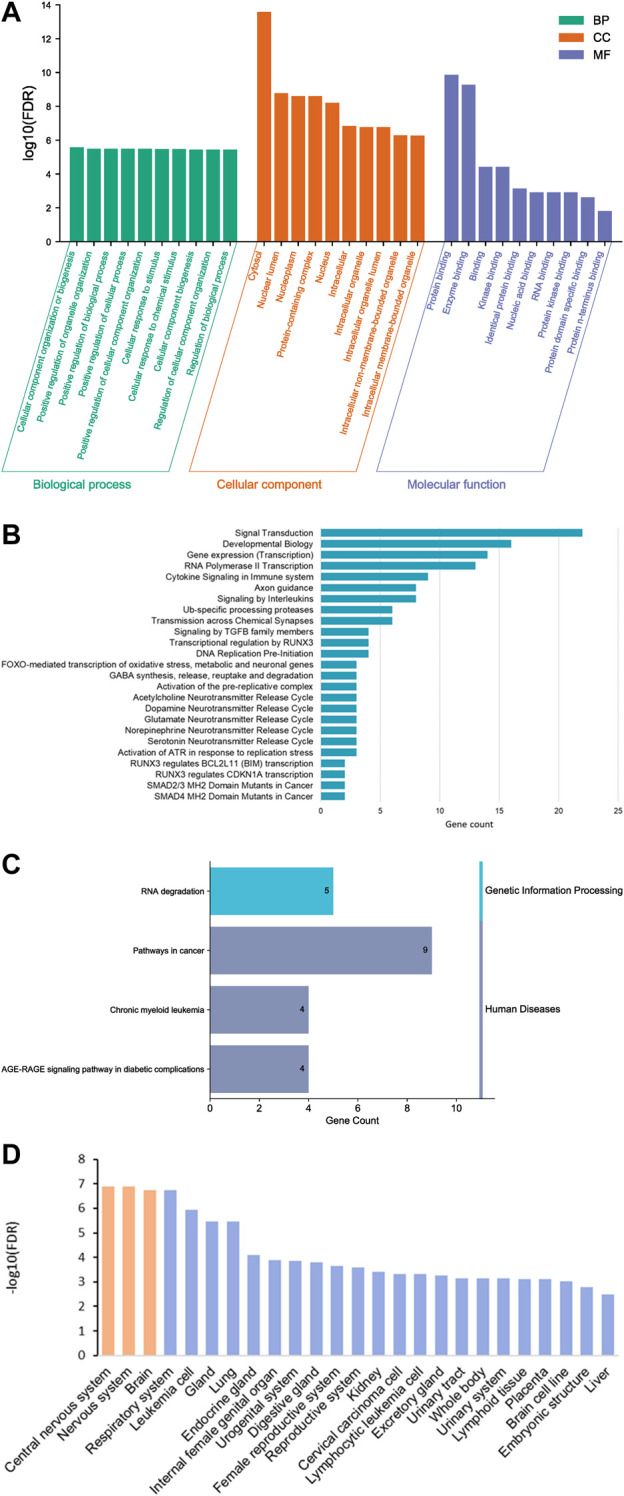
Gene ontology (GO) functional analysis histogram (A), bar plot of Reactome (B) and KEGG pathway enrichment analysis (C) and enriched tissues (D).

Gene ontology (GO) functional analysis histogram (A), bar plot of Reactome (B) and KEGG pathway enrichment analysis (C) and enriched tissues (D).