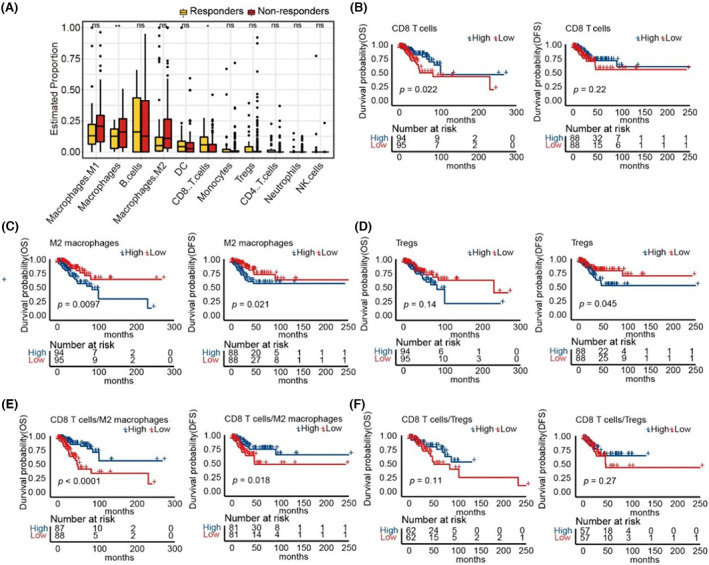
FIGURE 4.

Integration of CD8 T lymphocytes and M2 macrophages can further distinguish patients who benefitted from the treatment. (A) Proportion of 11 major TILs from TNBC patients in TCGA. (B) Kaplan–Meier curves of OS and DFS comparing CD8 T cells‐H with CD8 T cells ‐L from TNBC patients in TCGA. (C) Kaplan–Meier curves of OS and DFS comparing M2 macrophages‐H with M2 macrophages‐L from TNBC patients in TCGA. (D) Kaplan–Meier curves of OS and DFS comparing Tregs‐H with Tregs‐L from TNBC patients in TCGA. (E) Kaplan–Meier curves of OS and DFS comparing CD8 T cells/M2 macrophages‐H with CD8 T cells/M2 macrophages‐L from TNBC patients in TCGA. (F) Kaplan–Meier curves of OS and DFS comparing CD8 T cells/Tregs‐H with CD8 T cells/Tregs‐L from TNBC patients in TCGA.
