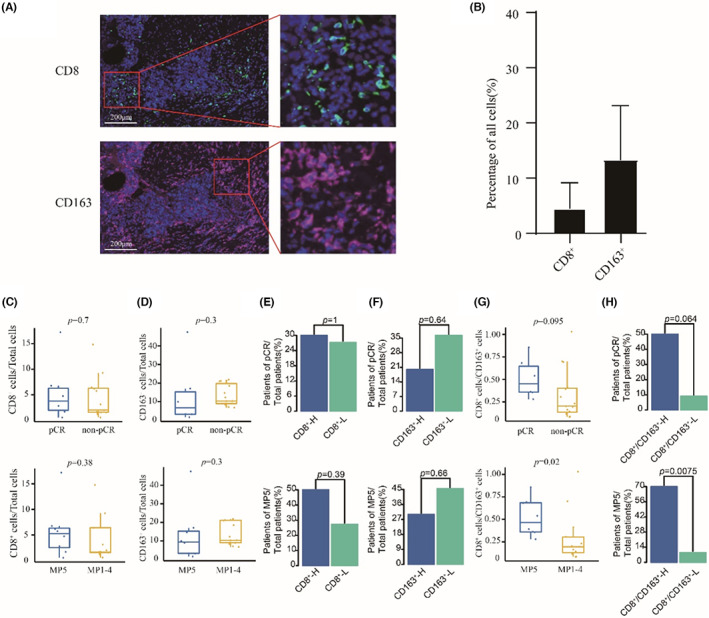
FIGURE 5.

The response rate was higher in patients with high ratio of CD8 to CD163. (A) Representative images from mIHC analysis of CD8 T cell marker (CD8: blue) and M2 macrophage marker (CD163: red). (B) Distribution of CD8 and CD163 from 21 TNBC patients. (C–D) Comparison of CD8 (C) and CD163 (D) between responders and non‐responders. (E) Barplots of pCR rate and MP5 grade rate between CD8‐H group and CD8‐L group. (F) Barplots of pCR rate and MP5 grade rate between CD163‐H group and CD163‐L group. (G) Comparison of CD8/CD163 between responders and non‐responders. (H) Barplots of pCR rate and MP5 grade rate between CD8/CD163H group and CD8/CD163‐L group.
