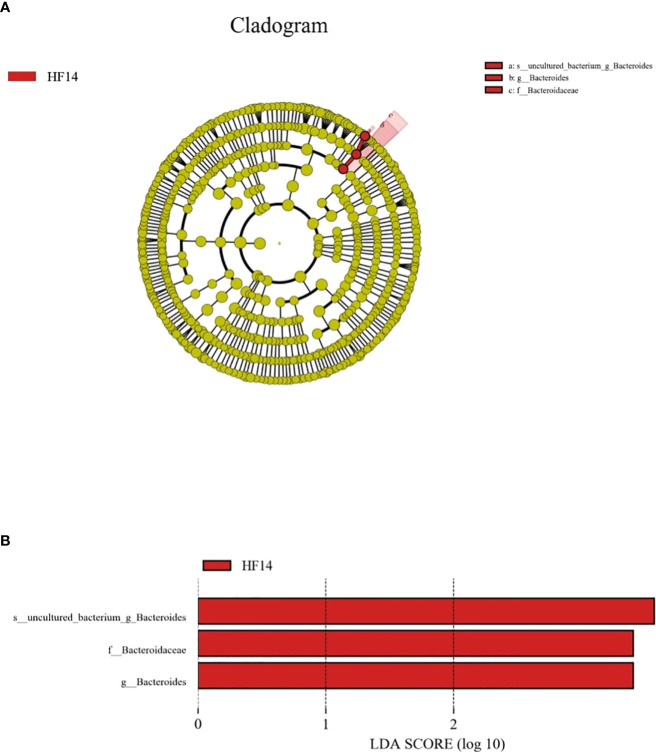
Figure 9.
The potential biomarkers were defined by LEfSe. (A) Cladogram for taxonomic representation of significant differences between the five groups. The colored nodes from the inner to the outer circles represent taxa from the phylum to the genus level. The significantly different taxa are signified by different colors representing the five groups. (B) Histogram of the LDA scores for differentially abundant features among the groups. The threshold on the logarithmic LDA score for discriminative features was set to 3.0.

