Figure 5.
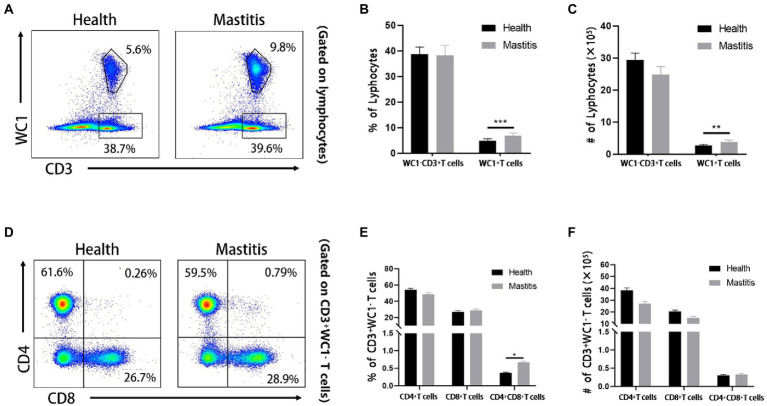
Phenotypic analysis of T cell subsets of cows of different groups. (A) Representative dot plots of WC1+ γδ T cells and WC1− CD3+ T cells from two groups. Percentage (B) and absolute number (C) of WC1− CD3+ T and WC1+ γδ T cells in lymphocytes. (D) Representative dot plots of bovine CD4+ CD8−, CD8+ CD4− and CD8+ CD4+ T cells from healthy and mastitis groups. Percentage (E) and absolute number (F) of CD4+, CD8+ and CD8+ CD4+ DP T cells in WC1− CD3+ T cells.

