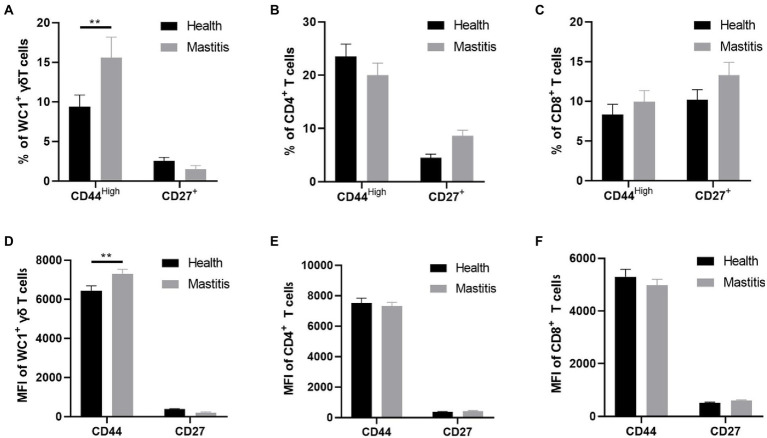
Figure 6.
Difference of CD44 and CD27 expression in different subsets of T cells (CD4+, CD8+, WC1+) of health and mastitis calves. Representative histograms show CD44high and CD27 expression on CD4+CD8− (A), CD4− CD8+ (B) T cells and WC1+γδ T cells (C) from the blood of health and mastitis calves. Bar graphs show MFI of CD44 and CD27 on CD4+ (D), CD8+ T cells (E) and WC1+γδ T cells (F) from the two groups.

