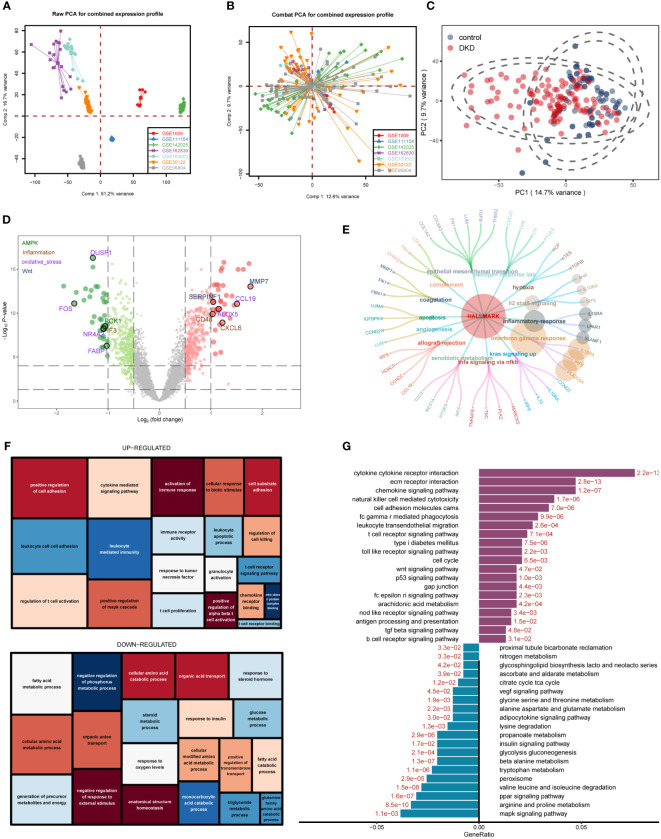
Figure 1.
Differentially expressed gene (DEG) identification of diabetic kidney disease (DKD) and enrichment analysis. (A, B) Principal component analysis (PCA) showing the expression distribution of seven DKD datasets before (A) and after (B) batch effect removal. (C) PCA analysis revealed significant differences in transcriptome levels between DKD samples and normal samples. (D) Volcano plot of differentially expressed genes (DEGs) between DKD samples and normal samples. The DEGs in the pathways related to the occurrence and development of DKD reported in the literature are displayed in different colors. Hallmark gene sets (E), gene ontology (GO) (F), KEGG (G) enrichment landscape of the reference gene set.

