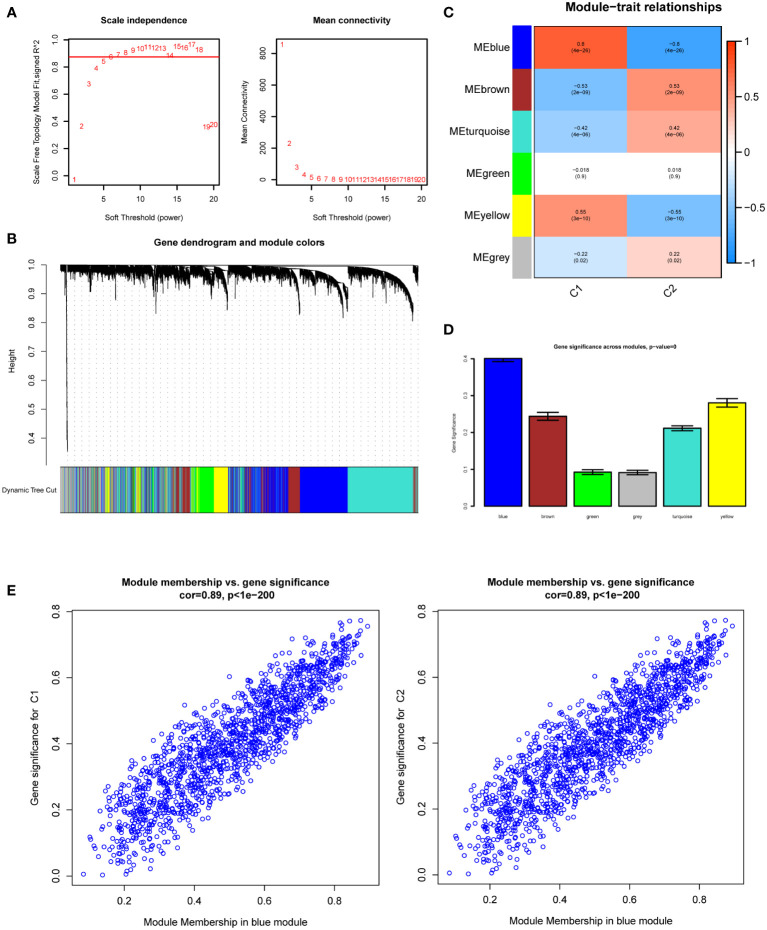
Figure 3.
Weighted Gene Co-Expression Network Analysis (WGCNA). (A) Scale-free fit index and network connectivity under different soft thresholds. (B) The gene hierarchical clustering dendrogram. The modules corresponding to the branches are marked with color represented by the color band under the tree. (C) Heatmap of the correlation between gene modules and DKD subtypes. (D) Absolute value comparison of the correlation between genes within each module and DKD subtypes. (E) Scatter plot of module eigengenes in blue module.

