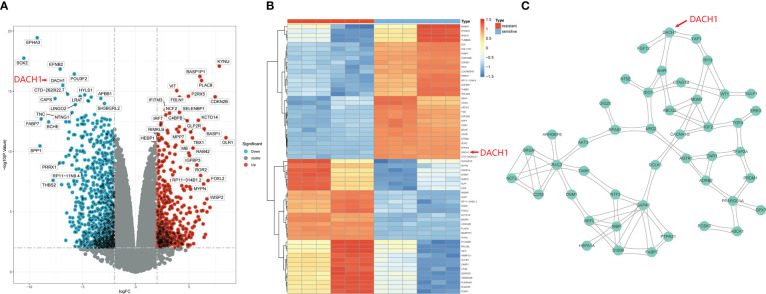
Figure 1.
Identification of hub DEGs. (A) DEGs are shown by the volcano plot. Red dots represent genes that are upregulated in the resistance group (logFC > 2 and P.value < 0.01), and green dots represent genes that are downregulated (logFC < 2 and P.value < 0.01). (B) The heatmap shows the top 30 up-regulated and top 30 down-regulated genes in the drug resistance group. Red means genes up-regulated and blue means genes down-regulated. (C) 45 hub DEGs PPI network.

