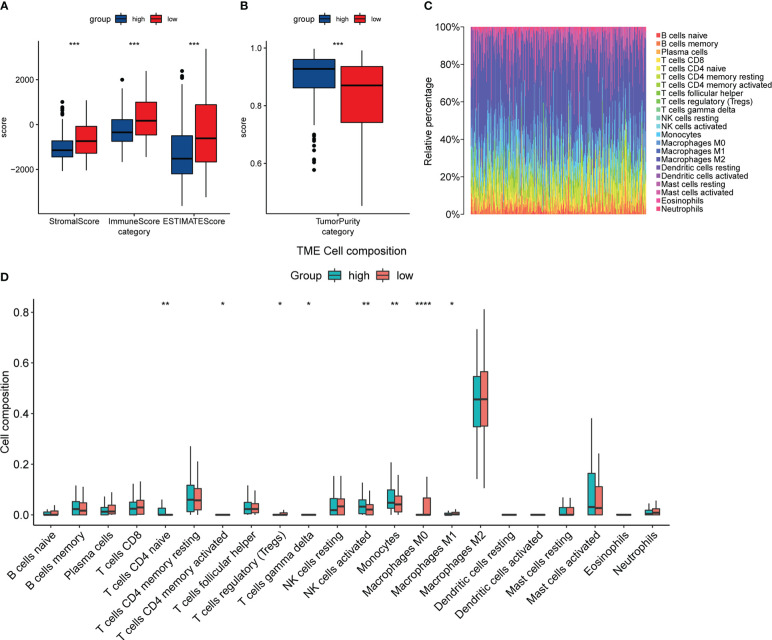
Figure 11.
The relationship between the expression of DACH1 and the immune infiltration status. (A) The StromalScore, ImmuneScore, and ESTIMATEScore were significantly higher in the low-risk group than in the high-risk group (P < 0.05). (B) The TumorPurity was significantly lower in the low-risk group than in the high-risk group (P < 0.05). (C) The proportion of 22 immune cell types in the 188 patients in the training set. (D) The DACH1 low expression group had more regulatory T cells and fewer NK cells activated.

