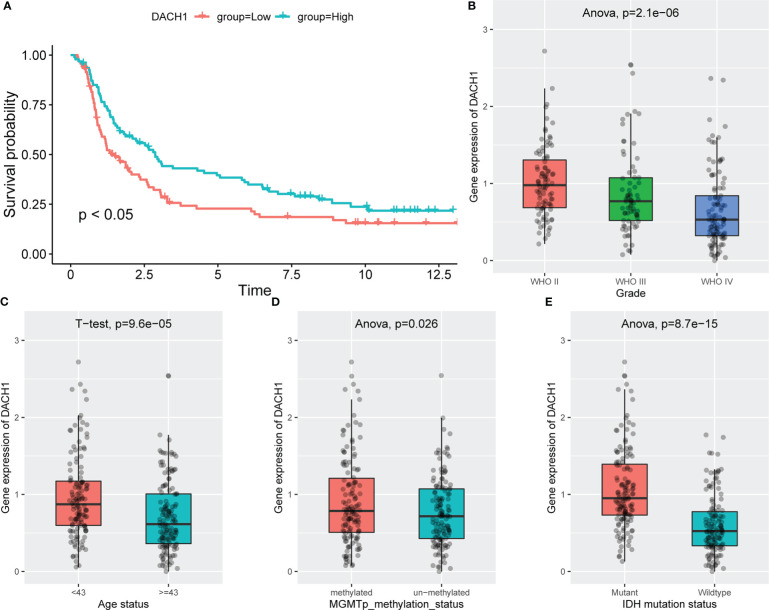
Figure 12.
The relationship between the expression of DACH1 and clinical features. (A) Red indicates the DACH1 low expression group, and green indicates the DACH1 high expression group. Patients with low expression had a lower survival rate than those with high expression (P < 0.05). (B) The expression of DACH1 decreases with increasing glioma grade. (C) The expression of DACH1 in the >=43-year-old group was significantly lower than that in the <43-year-old group (P < 0.05). (D) The expression of DACH1 in the non-methylated group was significantly lower than that in the methylated group (P < 0.05). (E) The expression of DACH1 in the IDH wild-type group was significantly lower than that in the IDH mutant group (P < 0.05).

