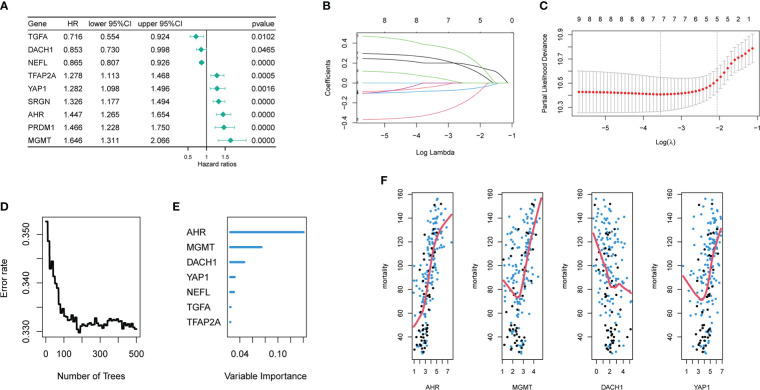
Figure 2.
Acquisition of signature genes and construction of risk models. (A) Nine genes were significantly associated with the prognosis of temozolomide-treated patient, among which the HR values of TGFA, DACH1, and NEEL were less than 1, and they played a protective role, while the HR values of TFAP2A, YAP1, SRGN, AHR, PRDM1, and MGMT were more than 1, and they played a risky role. (B) The nine different colored lines represent nine different variables. As log(λ) increases, the regression coefficients of variables start to converge, eventually reaching 0. (C) As the variables gradually converge, the partial likelihood deviance changes in a waveform. When the number of variables is 7, the model performs best. When the number of variables is 5, the model is the simplest. (D) As the number of decision trees increases, the error rate gradually decreases. (E) Variable importance ranking in random forests (F) The top 4 variables of importance in the random forest. (The x-axis represents gene expression level, the y-axis represents mortality, and the red line is the fitted curve.).

