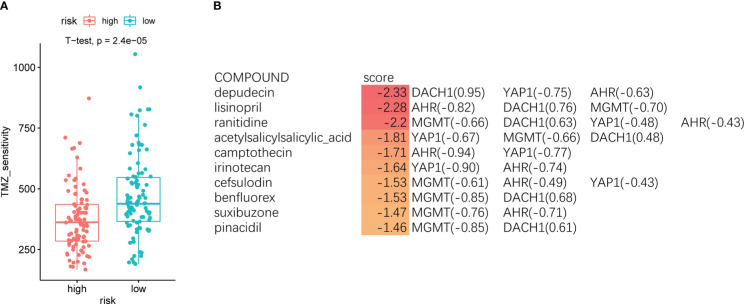
Figure 4.
(A) The red indicates the high-risk group, and the green indicates the low-risk group. Patients in the high-risk group had significantly lower temozolomide sensitivity than the low-risk group (P < O.O5). (B) The top 10 compounds predicted by the SPIED3 website that reversed feature gene expression.

