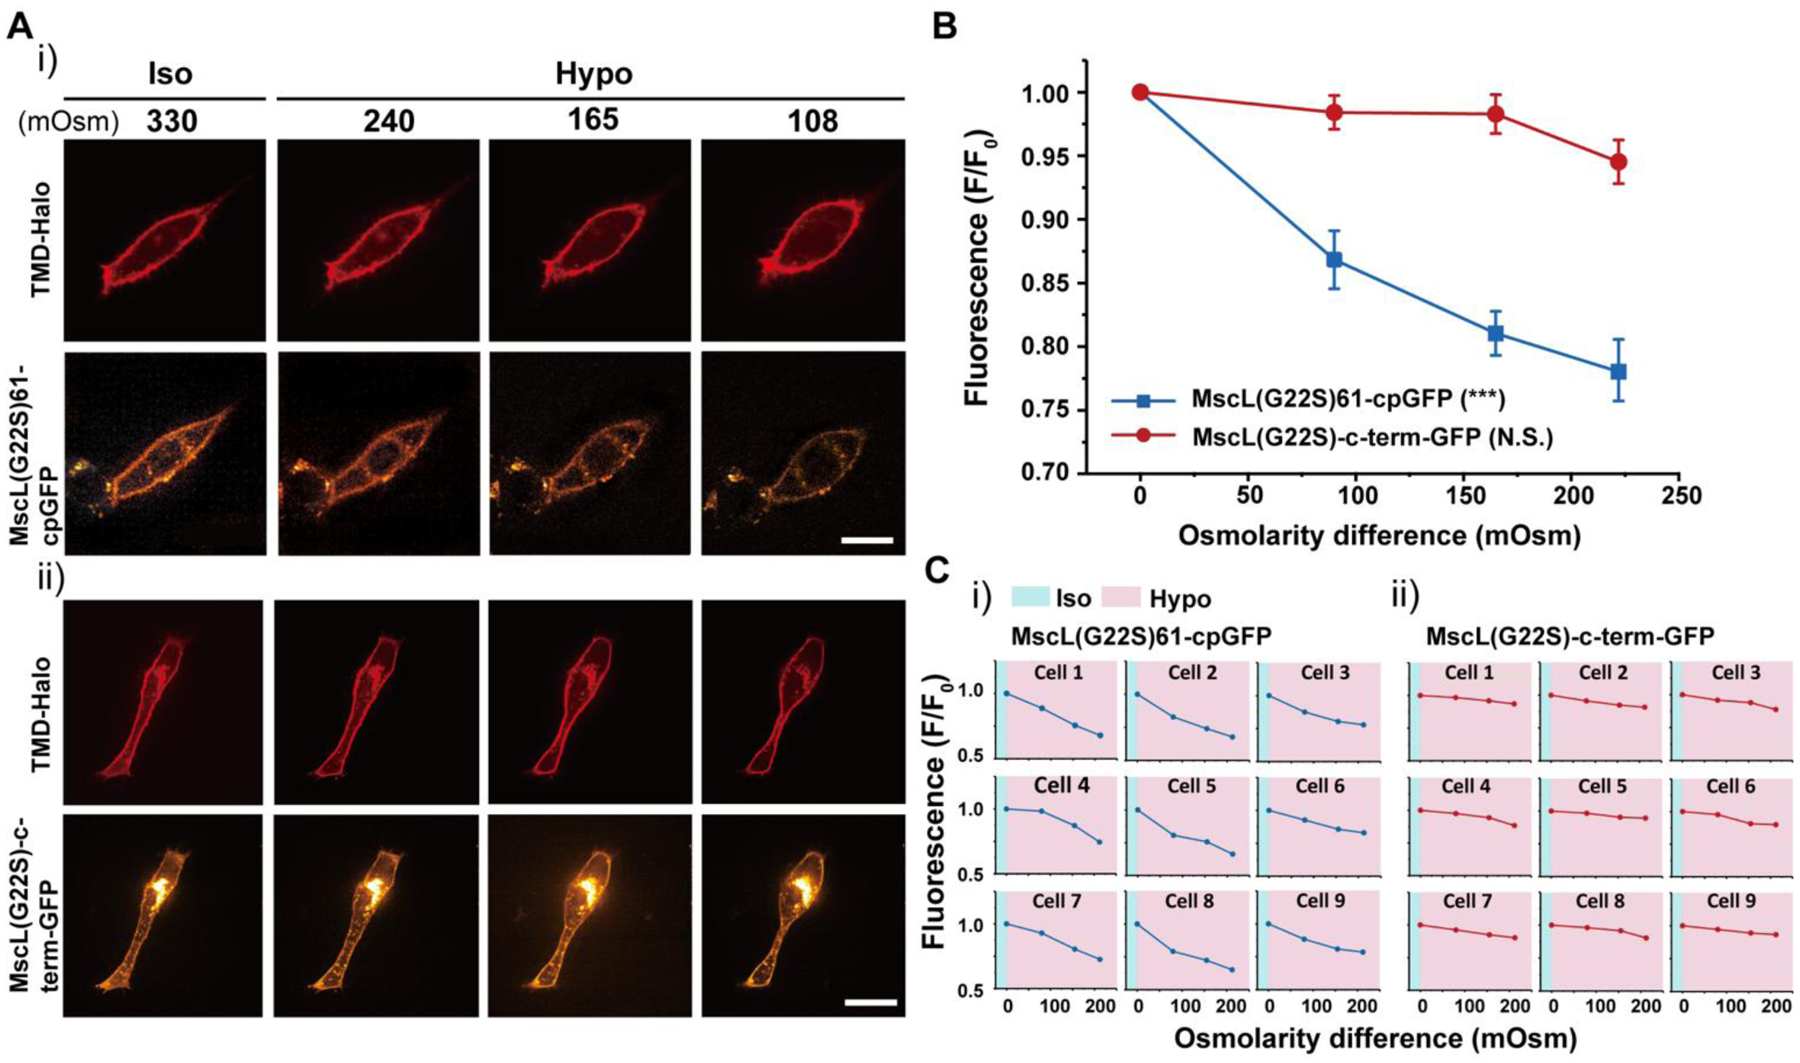
Figure 2.

NIH3T3 cells transfected with the MscL tension reporter in response to osmotic pressure. (A) (i) Confocal images showing the membrane localization of the MscL(G22S)61-cpGFP in NIH3T3 cells in response to different osmotic shocks. Transfected cells were cultured in iso-osmotic condition for 2 days and then DI water was sequentially added to the cell culture media to create increasing hypo-osmotic environments. Each image was taken four minutes after the addition of DI water. (ii) Confocal images showing the NIH3T3 cells transfected with the MscL(G22S)-c-term-GFP construct as a control in response to different osmotic shocks. The experiment followed the same method as mentioned in (i). (B) Normalized fluorescence intensities of the cell membranes of NIH3T3 cells transfected with the MscL tension reporter (MscL(G22S)61-cpGFP) or MscL(G22S)-c-term-GFP under different osmotic conditions corresponding to the experiment mentioned in (A). (C) Normalized fluorescence intensities of the MscL tension reporter (i) and MscL(G22S)-c-term-GFP control (ii) localizing on cell membranes of nine different NIH3T3 cells, from three separate experiments, at increasing osmotic pressures. Scale bars: 10 μm. The error bars denote standard error. ***: p < 0.001.
