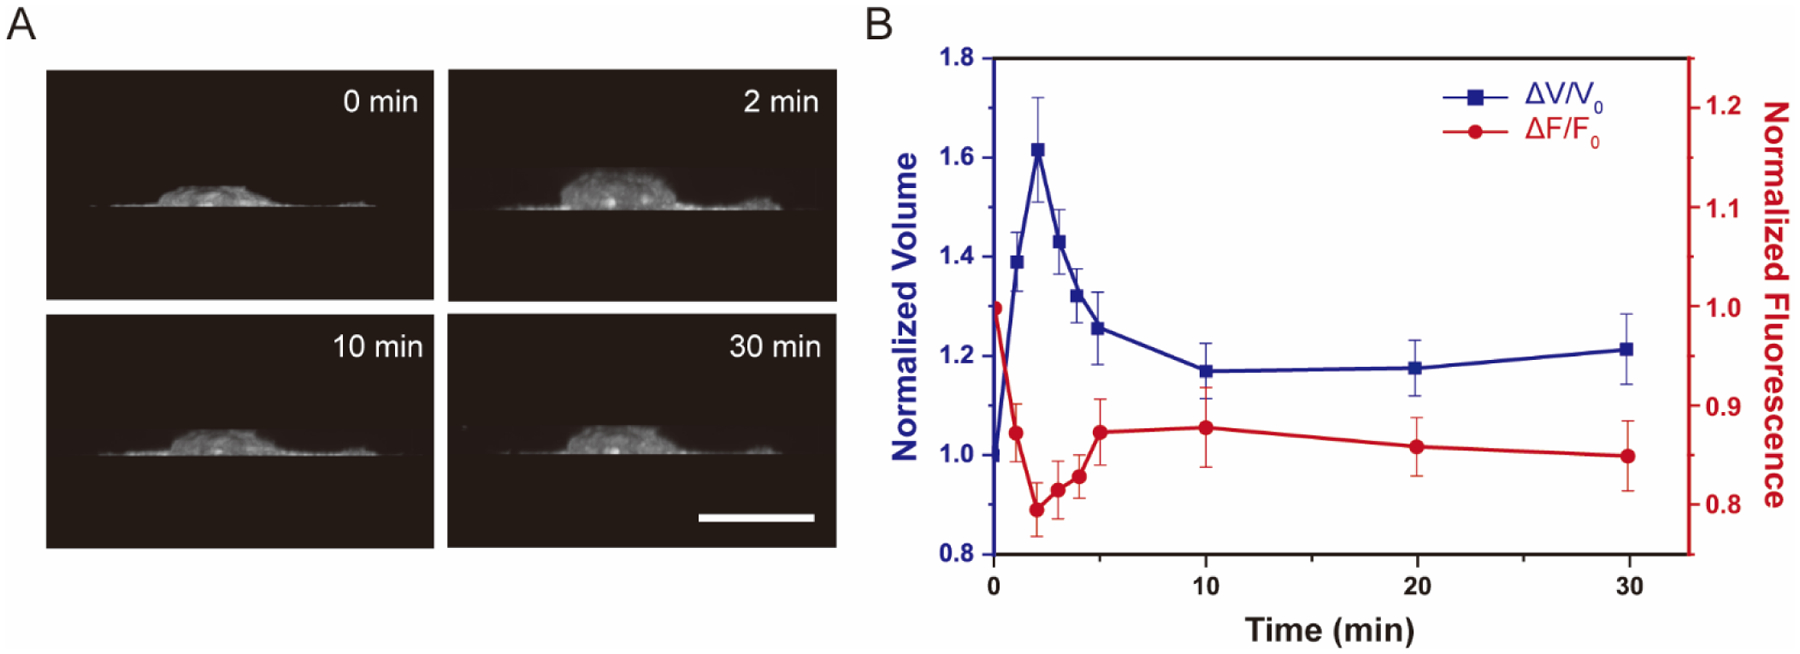
Figure 4.

Volume and membrane fluorescence dynamics of NIH 3T3 cells expressing the MscL membrane tension reporter (MscL(G22S)61-cpGFP) exposed to a hypotonic (~165mOsm) solution. (A) 3D reconstruction of cell volume using ImageJ 3D projection. (B)Normalized volume change and cpGFP fluorescence change under hypotonic shock of 165 mOsm. Confocal images were captured every 1 minute after osmotic shocks for the first 5 minutes followed by once every 5 minutes. Ten cells were analyzed for each condition from three independent experiments. Scale bars: 10 μm. The error bars denote standard error.
