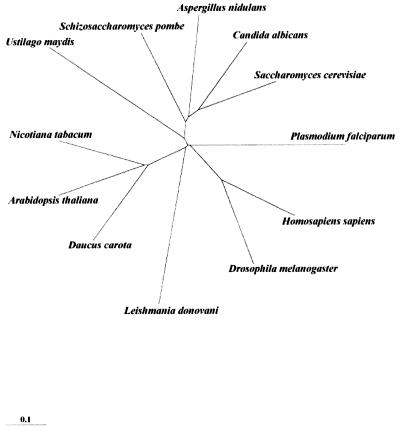
Figure 10.
Phylogenetic tree using the amino acid sequences of type I topoisomerases from L.donovani and other organisms. The phylogram is displayed on TREEVIEW that reads PHYLIP format treefiles under the CLUSTAL W program. The evolutionary scale bar is shown on the left, which indicates the relative distance on the tree in arbitrary units.

