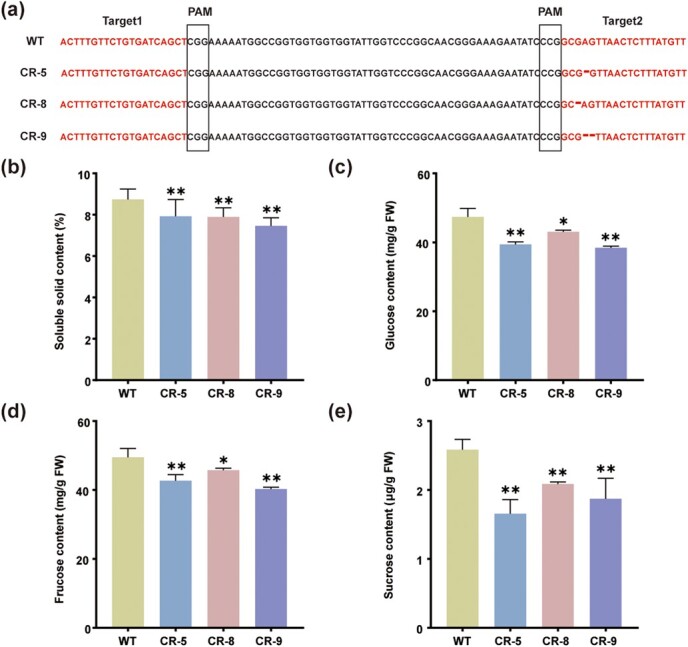
Figure 3.

SSC, glucose, fructose, and sucrose levels in STP1 knockout lines and WT. a Different types of editing in STP1 knockout lines. WT represents background accession TS-23 with high SSC. CR-5, CR-8, and CR-9 represent knockout lines with deletions of A, G, and AG in the coding region of STP1, respectively. b–e Determination of SSC (b), glucose (c), fructose (d), and sucrose (e) in red-ripe fruits of three knockout lines and WT. Data represent means ± standard deviation (n = 3). Asterisks indicate significant differences: *P ≤ .05, **P ≤ .01.
