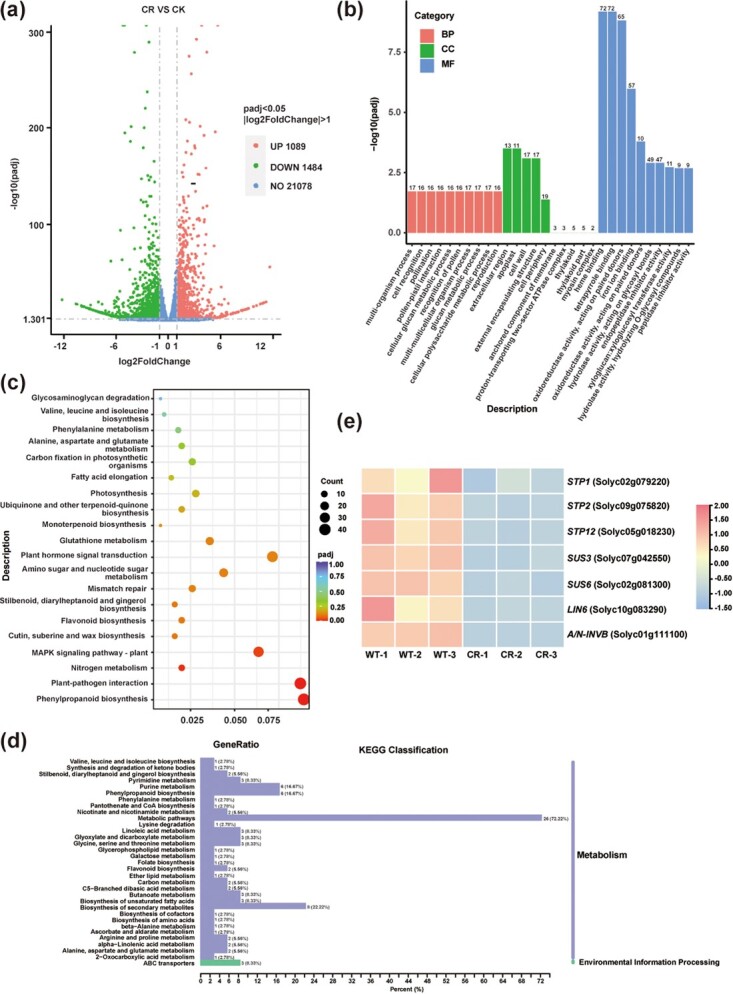
Figure 6.

DEGs and metabolites in STP1 knockout lines and WT. a Volcano map of DEGs. b, c Significantly enriched GO terms (b) and KEGG pathways (c) of DEGs. (d) KEGG pathways of differentially expressed metabolites. e Heat map of gene expression related to sugar metabolism from RNA-seq.
