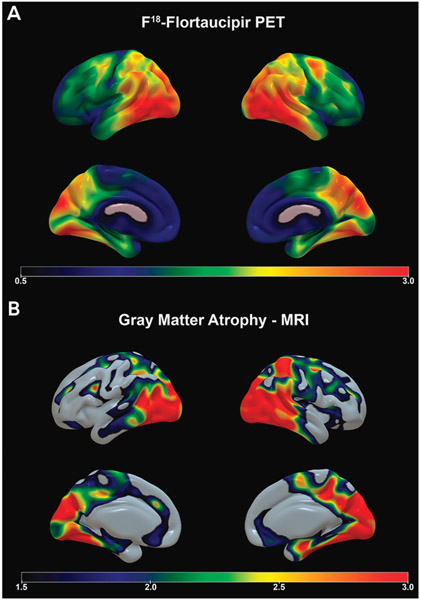
FIGURE 2-3.
Imaging of the patient in CASE 2-2. Amyloid imaging showed diffuse cortical and subcortical signal consistent with Alzheimer disease (not shown). A, Flortaucipir F 18 positron emission tomography (PET) shows intense tau ligand uptake in the visual associative parietooccipital and temporooccipital cortices as well as the primary visual areas, milder bilateral involvement of the frontal lobes, and relative sparing of the primary motor and sensory cortices. Flortaucipir F 18 PET images show the standardized uptake value ratio (SUVR) of tau, where warmer colors (yellow, red, and orange) indicate more tau uptake. B, Sagittal volumetric MRI presented in three-dimensional space shows profound temporoparietooccipital atrophy (bottom panel); warmer colors (yellow, red, and orange) indicate areas of greater gray matter atrophy.

