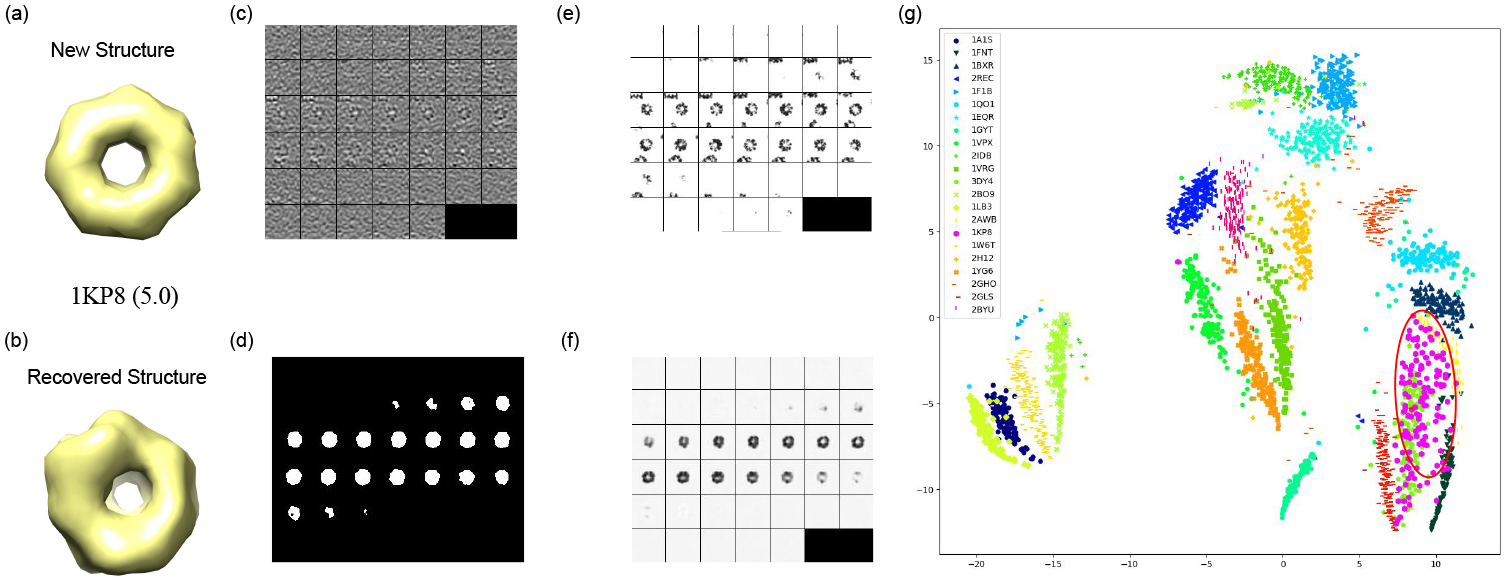
Figure 4:

The outputs of DSM-Net for the new structure GroEL (PDB ID: 1KP8) with respect to training data. (a) The isosurfaces of true structure (b) The isosurfaces of recovered structure (c) Subtomogram of GroEL (d) Segmented region of GroEL (e) True structure of subtomogram (f) Recovered structure of subtomogram (g) The visualization of subtomograms in dataset A embedded to using T-SNE. The region enriched with GroEL subtomograms is highlighted using red circle.
