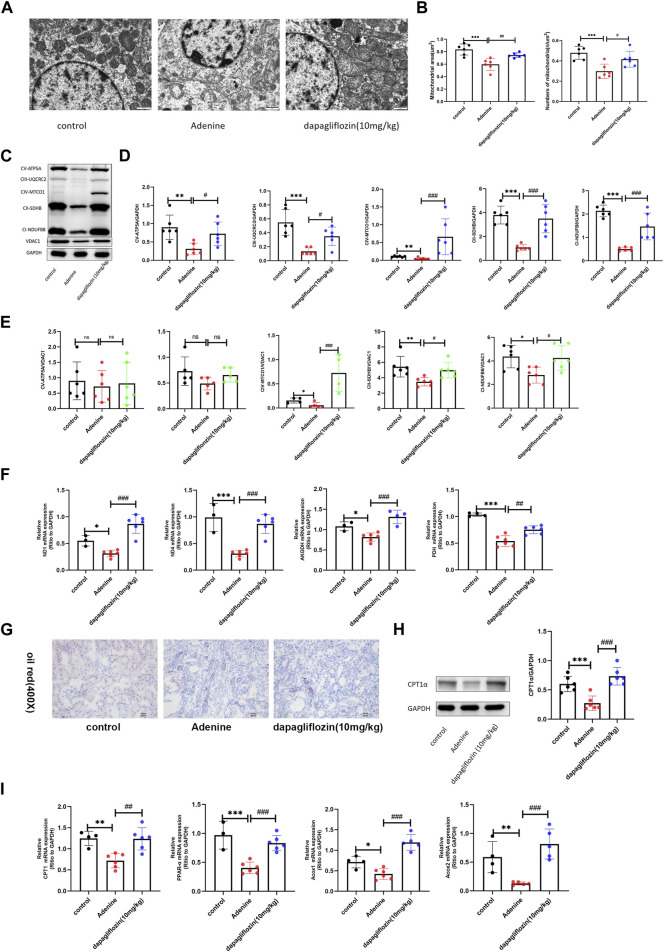
FIGURE 4.
Dapagliflozin increased the levels of mitochondrial metabolism and fatty acid oxidation in 0.2% adenine diet-fed mice. (A) Mitochondrial morphology of renal tubular epithelial cells was examined using transmission electron microscopy. Scale bars, 1 μm. (B) Mitochondrial areas and amount in renal tubular cell of each group. (C–E) Western blot showing the expression of mitochondrial respiratory chain complexes (oxphos) in the renal tissue of each group. (F) Real time PCR showing the expression of mitochondrial metabolism-related genes ND1, ND4, AKGDH, and PDH in the renal tissue of each group. (G) Renal oil red staining of each group. Scale bars, 20 μm. (H)Western blot showing the expression of CPT-1α of in the renal tissue of each group. (I) Real time PCR showing the expression of fatty acid oxidation-related genes CPT1, PPAR-α, ACOX1, and ACOX2 in the renal tissue of each group. Values are means ± SD.*p < 0.05 adenine diet group compared with the control group; **p < 0.01 adenine diet group compared with the control group; ***p < 0.001 adenine diet group compared with the control group; # p < 0.01 dapagliflozin treatment group compared with the adenine diet group; ## p < 0.01 dapagliflozin treatment group compared with the adenine diet group; ### p < 0.001 dapagliflozin treatment group compared with the adenine diet group.

