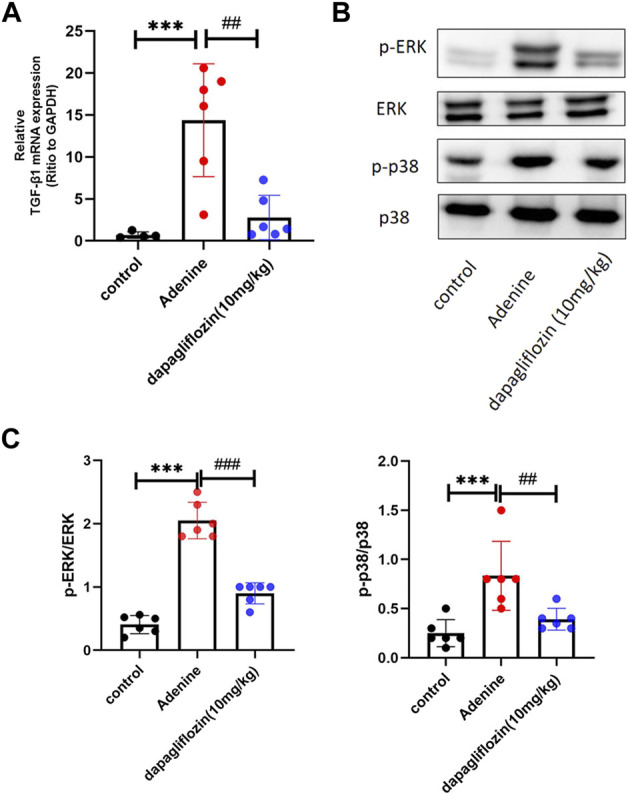
FIGURE 5.

Dapagliflozin alleviated inflammation and increased antioxidant proteins in 0.2% adenine diet-fed mice. (A) Real time PCR showing the expression of IL-1β, IL-6, TNF-α, cxcl-1, and mcp-1 in the renal tissue in each group. (B) The activity of SOD and content of GSH in the renal tissue of each group. (C) The content of MDA in the renal tissue of each group. Values are means ± SD. **p < 0.01 adenine diet group compared with the control group; ***p < 0.001 adenine diet group compared with the control group; ## p < 0.01 dapagliflozin treatment group compared with the adenine diet group; ### p < 0.001 dapagliflozin treatment group compared with the adenine diet group.
