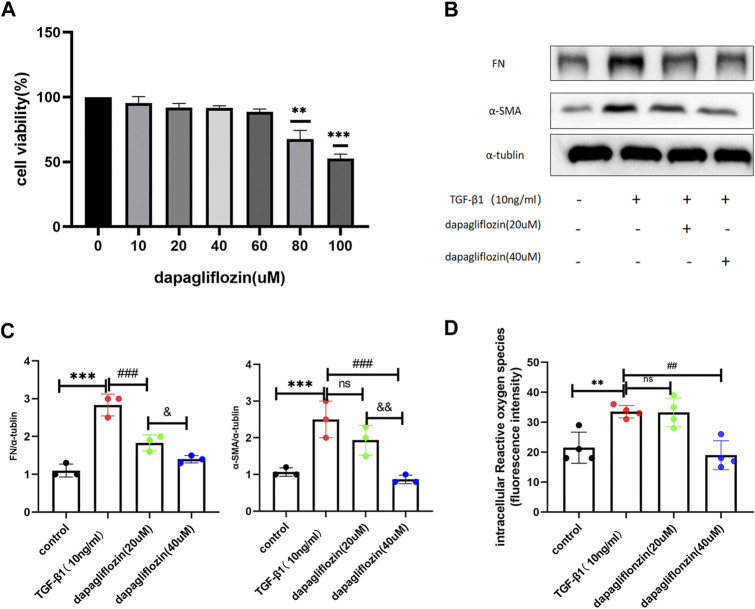
FIGURE 7.
Dapagliflozin reduced the expression of renal fibrosis-related markers in HK2 cells stimulated by TGF-β1. (A) CCK8 was used to evaluate the toxicity of dapagliflozin to normal cells. (B, C) Western blot showing the expression of FN and α-SMA in HK2 cells in each group. (D) The ROS content in HK2 in each group. ***p < 0.001 TGF-β1 stimulated group compared with the control group; Values are means ± SD. ### p < 0.001 dapagliflozin treatment group compared with TGF-β1 stimulation group; and p < 0.05 20 uM dapagliflozin treatment group compared with 40 uM dapagliflozin treatment group; and p < 0.01 20 uM dapagliflozin treatment group compared with the 40 uM dapagliflozin treatment group.

