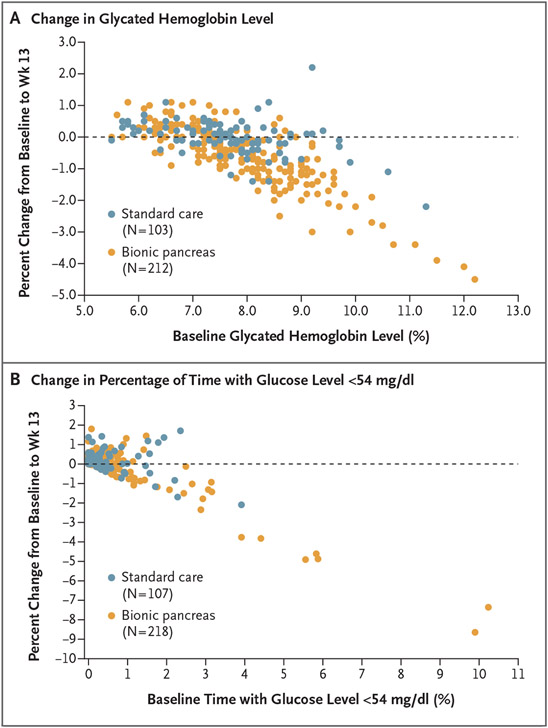
Figure 1. Changes in the Glycated Hemoglobin Level and the Percentage of Time with the Glucose Level below 54 mg per Deciliter from Baseline to Week 13, as Compared with Baseline.
Panel A shows a scatterplot of the change in the glycated hemoglobin level from baseline (randomization) to 13 weeks, as compared with the glycated hemoglobin level at baseline. Panel B shows a scatterplot of the change in the percentage of time with the glucose level below 54 mg per deciliter (3.0 mmol per liter), as assessed by continuous glucose monitoring, from baseline to week 13 as compared with the percentage of time with the glucose level below 54 mg per deciliter at baseline. In both panels, each point represents an individual participant, and participants with data plotted on the dashed horizontal line had no difference in the value at 13 weeks as compared with the baseline value.

