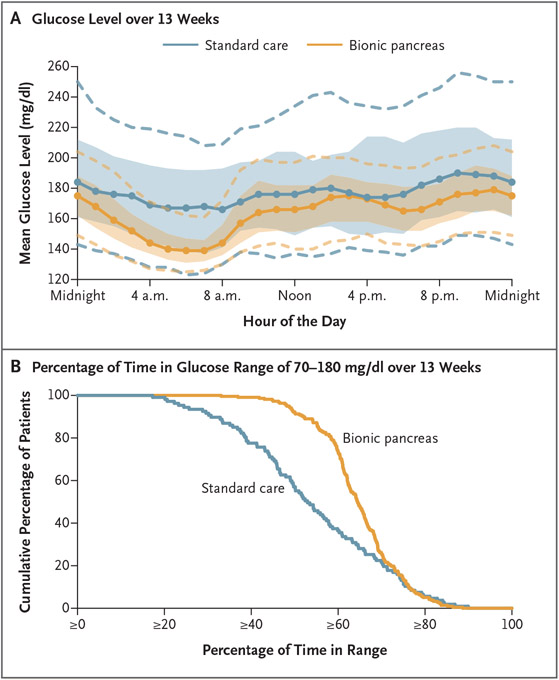
Figure 2. Mean Glucose Levels According to Time of Day and the Cumulative Distribution of Time in the Target Glucose Range.
Panel A shows an envelope plot of the glucose level as measured by continuous glucose monitoring over the 13-week trial, according to time of day. Solid circles denote the hourly median values of the participants’ mean glucose levels, and shaded regions indicate the interquartile range; dashed curves indicate the 10th and 90th percentiles. Panel B shows the cumulative distribution plot of the cumulative percentage of participants as compared with the percentage of time that the glucose level was within the range of 70 to 180 mg per deciliter (3.9 to 10.0 mmol per liter) as assessed by continuous glucose monitoring over the 13-week trial. To convert values for glucose to millimoles per liter, multiply by 0.05551.

