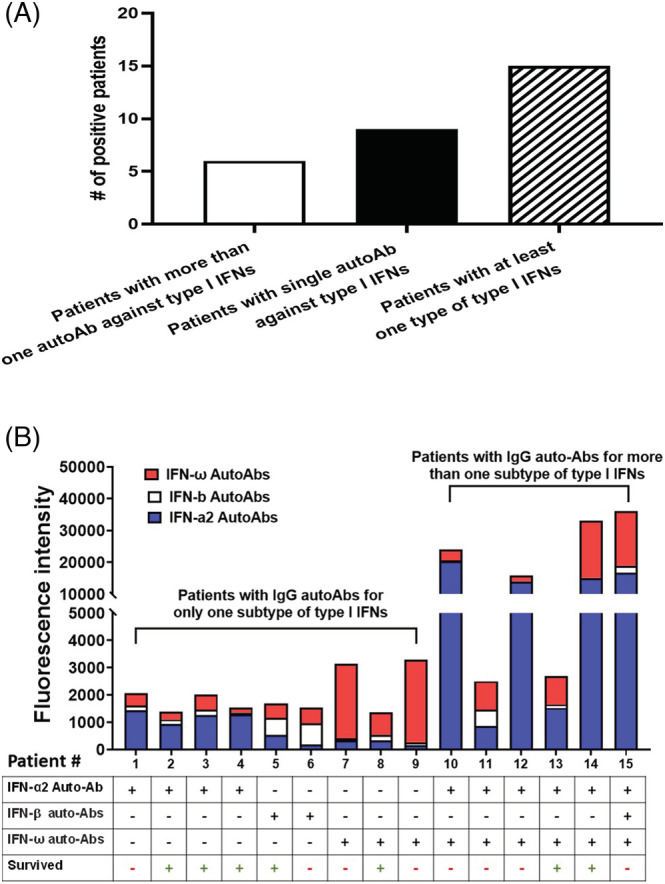
FIGURE 2.

(A) Distribution of the number of positive samples for patients with immunoglobulin G autoantibodies (auto‐Abs) for more than one subtype of type I interferons (IFNs) (IFN‐α2, IFN‐ω, and IFN‐β) and (IFN‐α2 and IFN‐ω) and patients with immunoglobulin G auto‐Abs for only one subtype of type I IFNs. (B) Distribution of auto‐Ab titers of patients with positive auto‐Abs samples and mortality.
