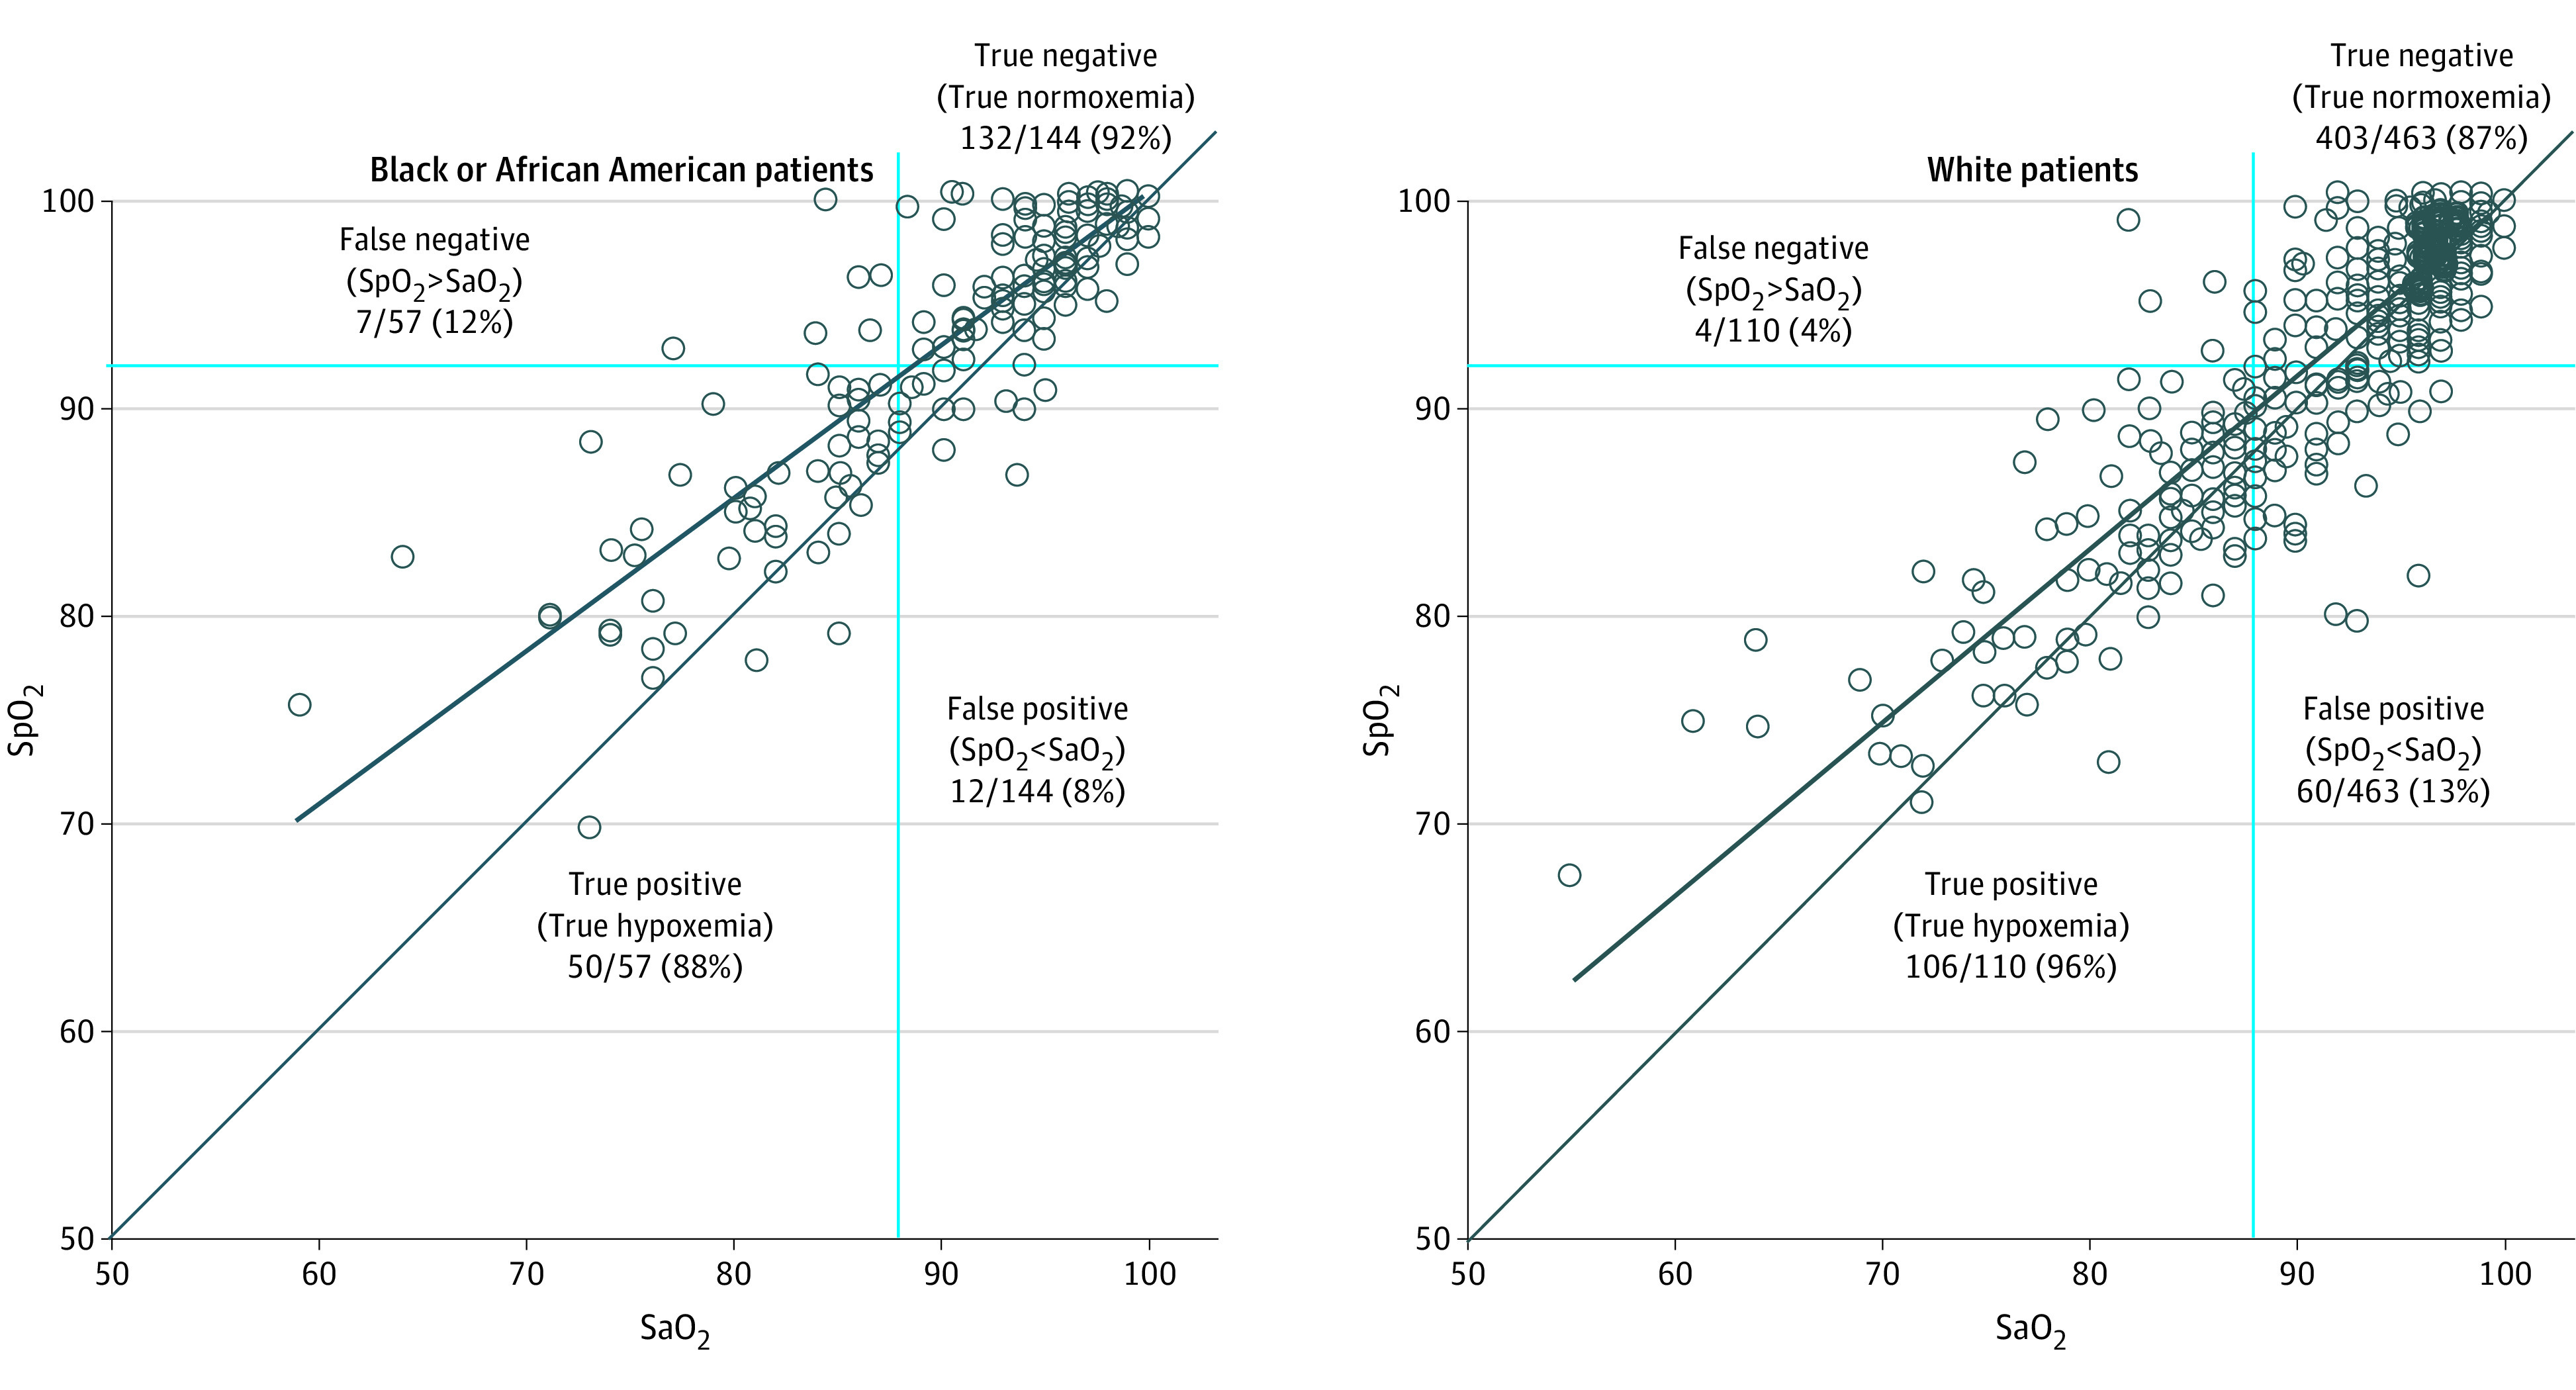
Figure. Scatterplots of Paired Pulse Oximetry (SpO2) and Arterial Blood Oxygen Saturation (SaO2) Observations for Black or African American Patients and White Patients.

Black solid lines represent the line of equality and the trend line for the given set of paired data points. Blue solid lines denote the following quadrants: true positive includes patients whose paired SaO2 and SpO2 measurements both indicate hypoxemia (SpO2 <92% and SaO2 <88%). True negative includes patients whose SaO2 and SpO2 both indicate normoxemia. False positive includes patients whose SaO2 is normoxemic but whose SpO2 may suggest hypoxemia. False negative includes patients whose Sao2 is hypoxemic but whose SpO2 wrongly suggests normoxemia, placing the patient at risk of undertreatment (withholding supplemental O2).
