
Figure 1.
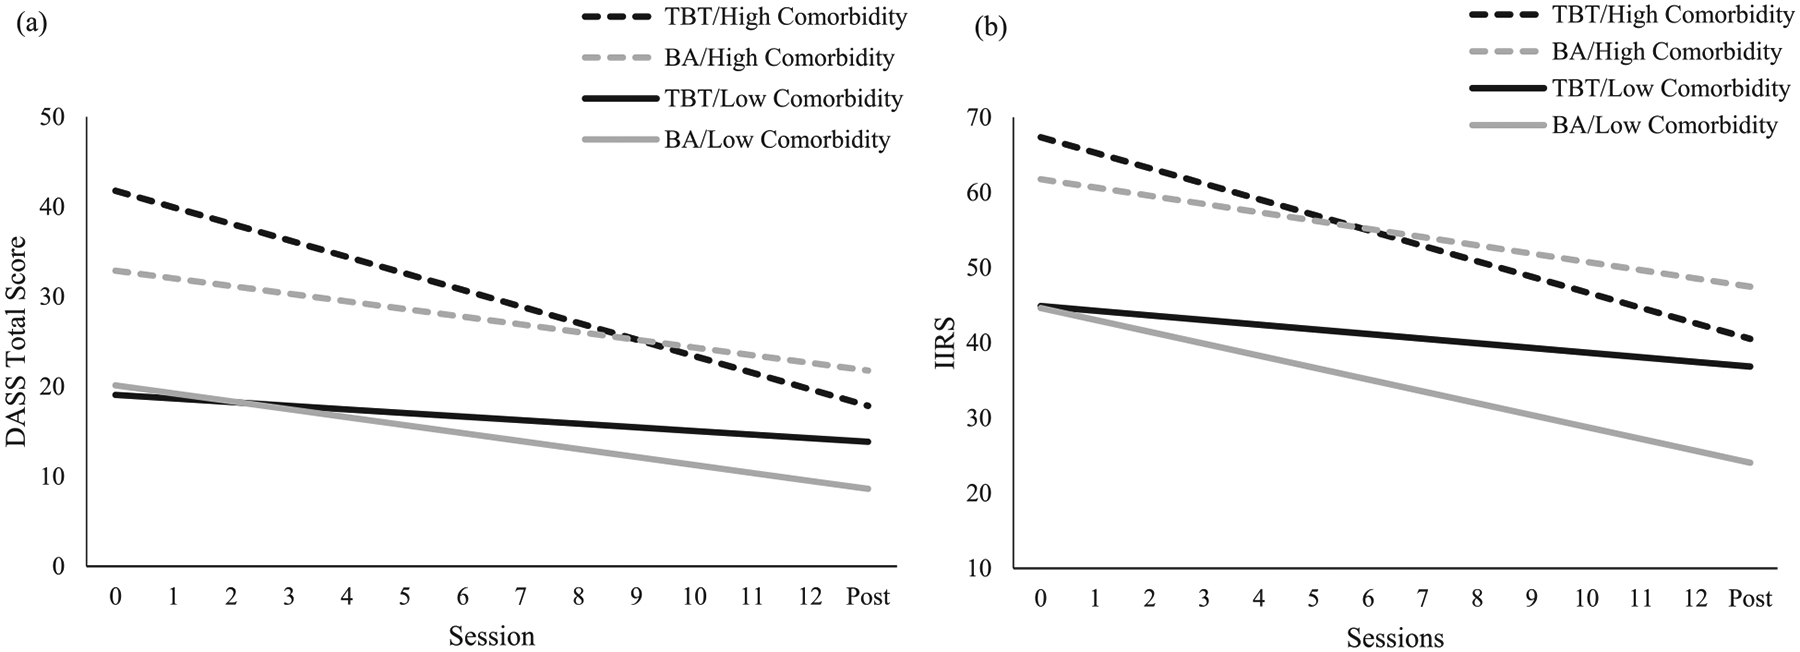
Panel a depicts global distress trajectories for BA (grey lines) vs. TBT (black lines) patients who have high (dashed lines) vs. low (solid lines) levels of clinician-rated diagnostic comorbidity. Panel b depicts transdiagnostic symptom interference trajectories for BA (grey lines) vs. TBT (black lines) patients who have high (dashed lines) vs. low (solid lines) levels of clinician-rated diagnostic comorbidity. High and low levels of comorbidity were represented as 1.5 SDs above and below the mean, respectively.
Note. DASS = Depression Anxiety Stress Scales; TBT = transdiagnostic behavior therapy; BA = behavioral activation; IIRS = Illness Intrusiveness Ratings Scale.