
FIGURE 2.
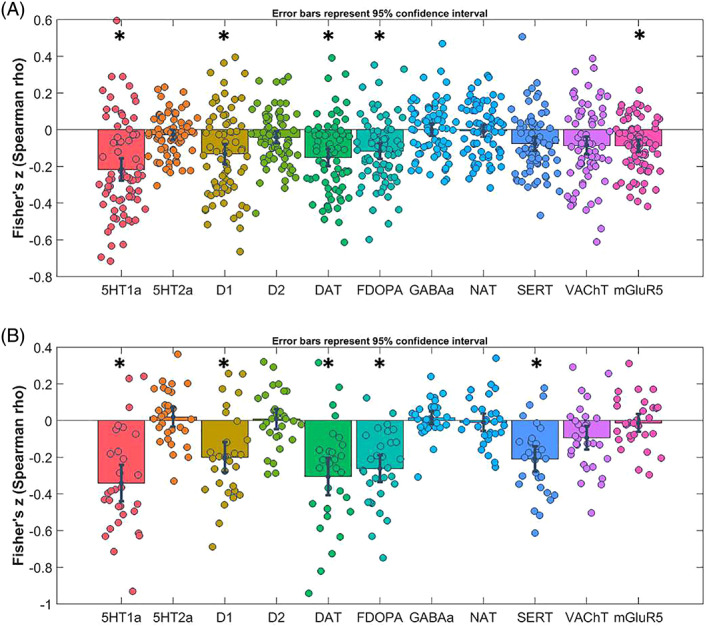
Results of spatial correlation analyses for PPA patients. Fisher's Z‐transformed correlation coefficients with respective neurotransmitter maps are displayed. Error bars represent the parametric 95% confidence interval of the mean. DAT, dopamine transporter; FDOPA, FluoroDOPA; GABAa, γ‐aminobutyric acid type A; NAT, noradrenaline; SERT, serotonin transporter. Panel A: Results of spatial correlation analyses in patients with nonfluent variant of primary progressive aphasia (avPPA); Panel B: Results of spatial correlation analyses in patients with semantic variant of primary progressive aphasia (svPPA). *p‐values < .004 (corrected for multiple comparisons)