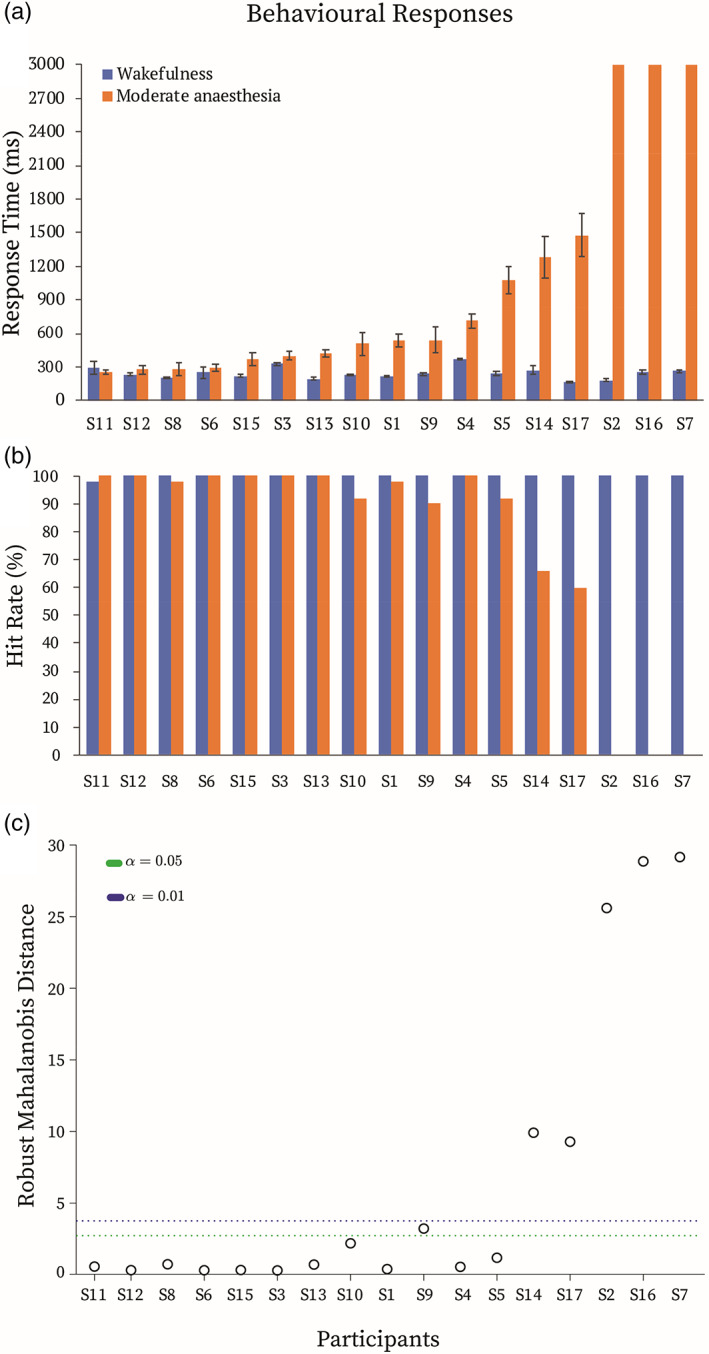
FIGURE 1.

Behavioural responses. (a) Reaction times and (b) hit rates during the auditory target detection task in the wakeful (blue) and moderate anaesthesia (orange) states. (c) Multivariate outlier detection based on the robust Mahalanobis distance measure. Green/blue dotted lines depict the significance threshold of p < .05/p < .01. For further analyses, participants that showed robust Mahalanobis distance significantly different from the rest at p < .01 (above the blue line) were labelled “slow” participants (N = 5), whereas the rest (below the blue line) were labelled “fast” participants (N = 12). The horizontal axis represents each individual (S1–S17 = Subject1–Subject17)
