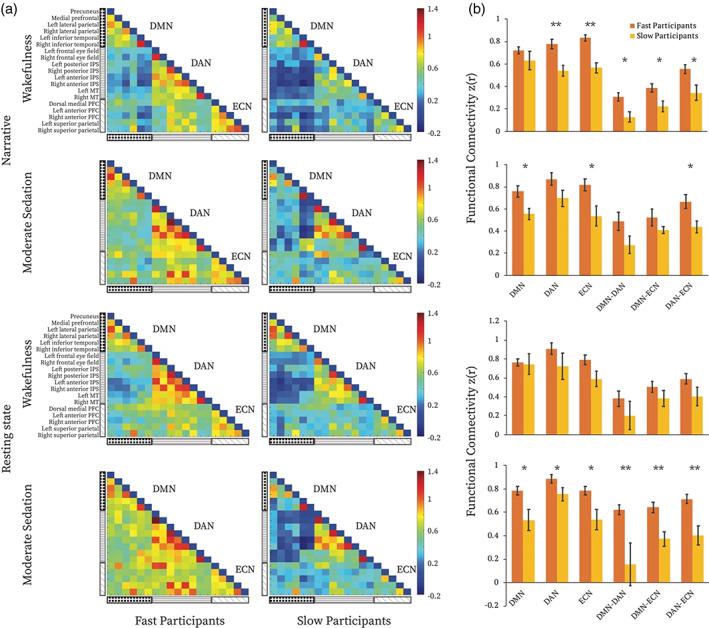
FIGURE 3.

Functional connectivity differences between fast and slow participants. (a) Functional connectivity (FC) matrices for the fast and slow participants during wakeful and moderate anaesthesia states in narrative and resting‐state conditions separately. The three black and white patterned rectangles on the left‐hand side represent, from top to bottom, the DMN, DAN, and ECN. The colour bar indicates z‐transformed Pearson correlation strength (low‐high: blue‐red). Each cell in the matrix represents FC between each node of the three networks. (b) Comparisons of averaged FC within and between the three brain networks, between fast and slow participants for each condition and state separately. * = p < .05 false discovery rate (FDR) corrected for multiple comparisons. DMN, default mode network; DAN, dorsal attention network; ECN, executive control network
