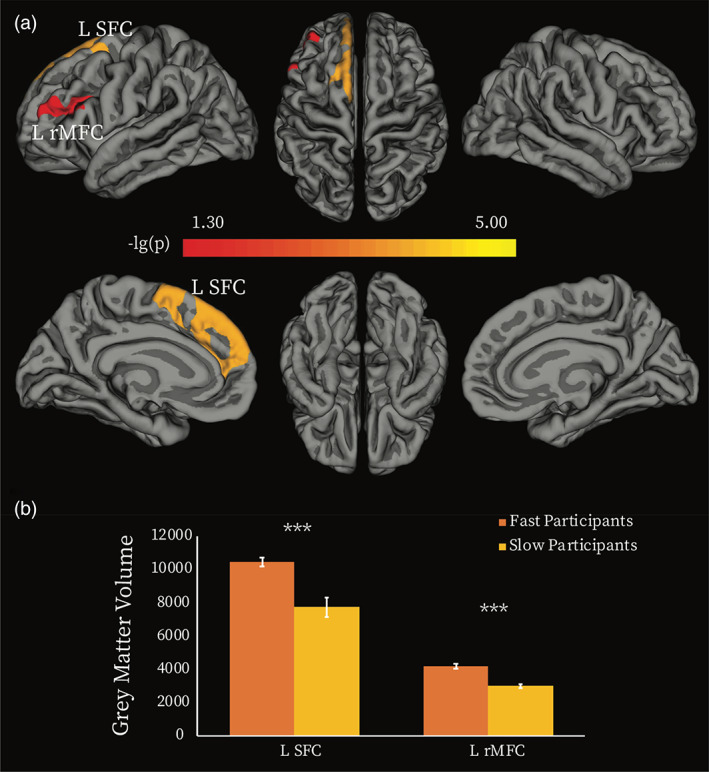
FIGURE 4.

Grey matter volume differences between fast and slow participants. (a) Vertex‐wise analysis. Two clusters showed significant between‐group difference in grey matter volume (GMV) (p < .05, Monte Carlo simulation corrected). Colour bar indicates the p‐value (‐lg(p)). (b) Averaged GMV was extracted for each of the two clusters, and between‐group comparisons of the averaged GMV were performed by using permutation tests. *** = p < .0005 false discovery rate (FDR) corrected for multiple comparisons. L SFC, left superior frontal cortex; L rMFC, left rostral middle frontal cortex
