
FIGURE 1.
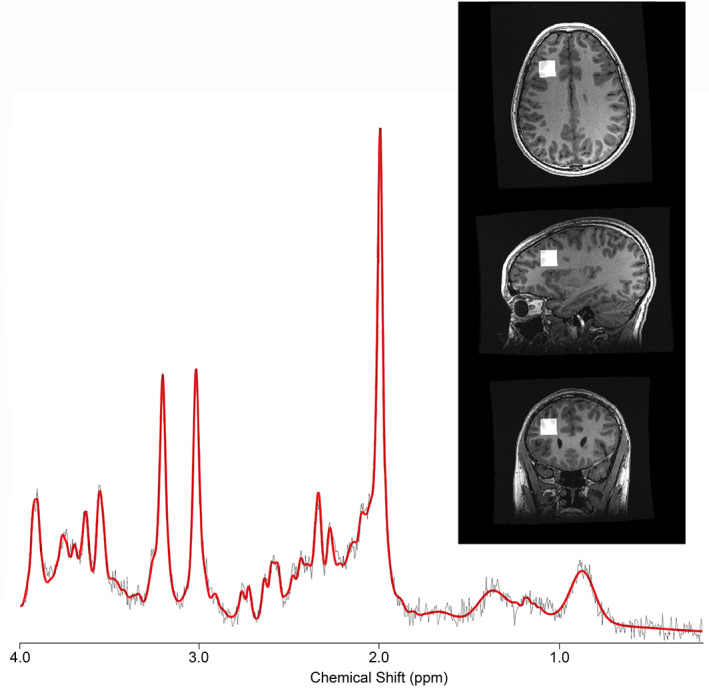
Representative spectrum from a single participant. The black line indicates the raw data, and the red line indicates the overall fit from LCModel after processing. The inset shows the voxel location in the left dorsolateral prefrontal cortex.