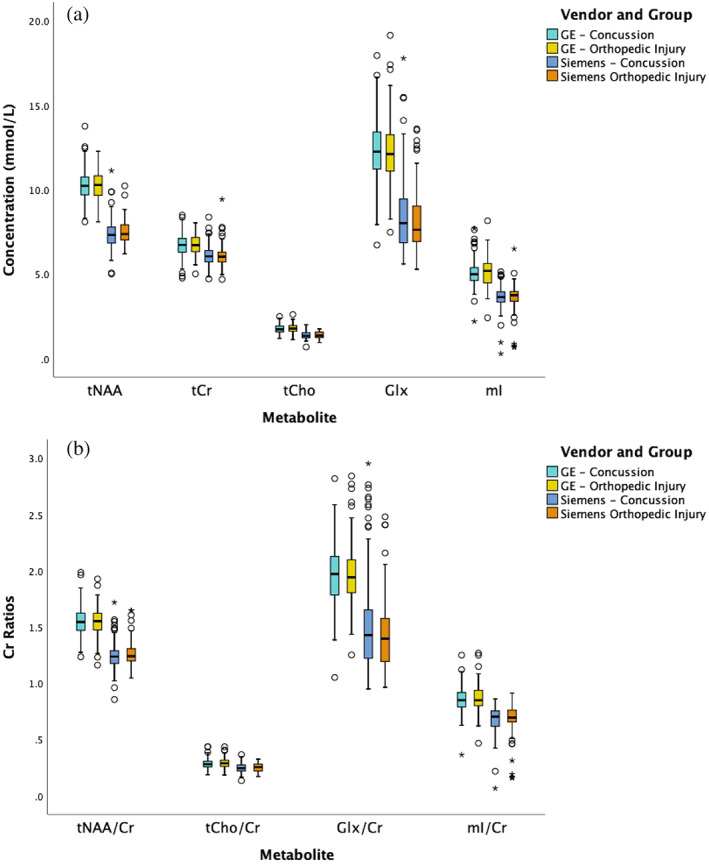
FIGURE 3.

(a) Absolute and (b) tCr‐referenced concentrations of all metabolites separated by the vendor and injury group. The black lines in the boxes represent the median and the box represents the interquartile range, with the 1.5 times the interquartile range values represented by the whiskers. The circles represent outliers (at least greater than 1.5 times the interquartile range from the median) and the asterisks represent statistically significant outliers (at least three times the interquartile range from the median); however, all data met quality control requirements and visual inspection did not suggest the data should be excluded. For all metabolites, there were no statistically significant differences between concussion and OI; however, for all metabolites there were statistically significant differences between vendors.
